


Product Tanker Supply, Part 1
Just when you had convinced yourself that owners had become rational

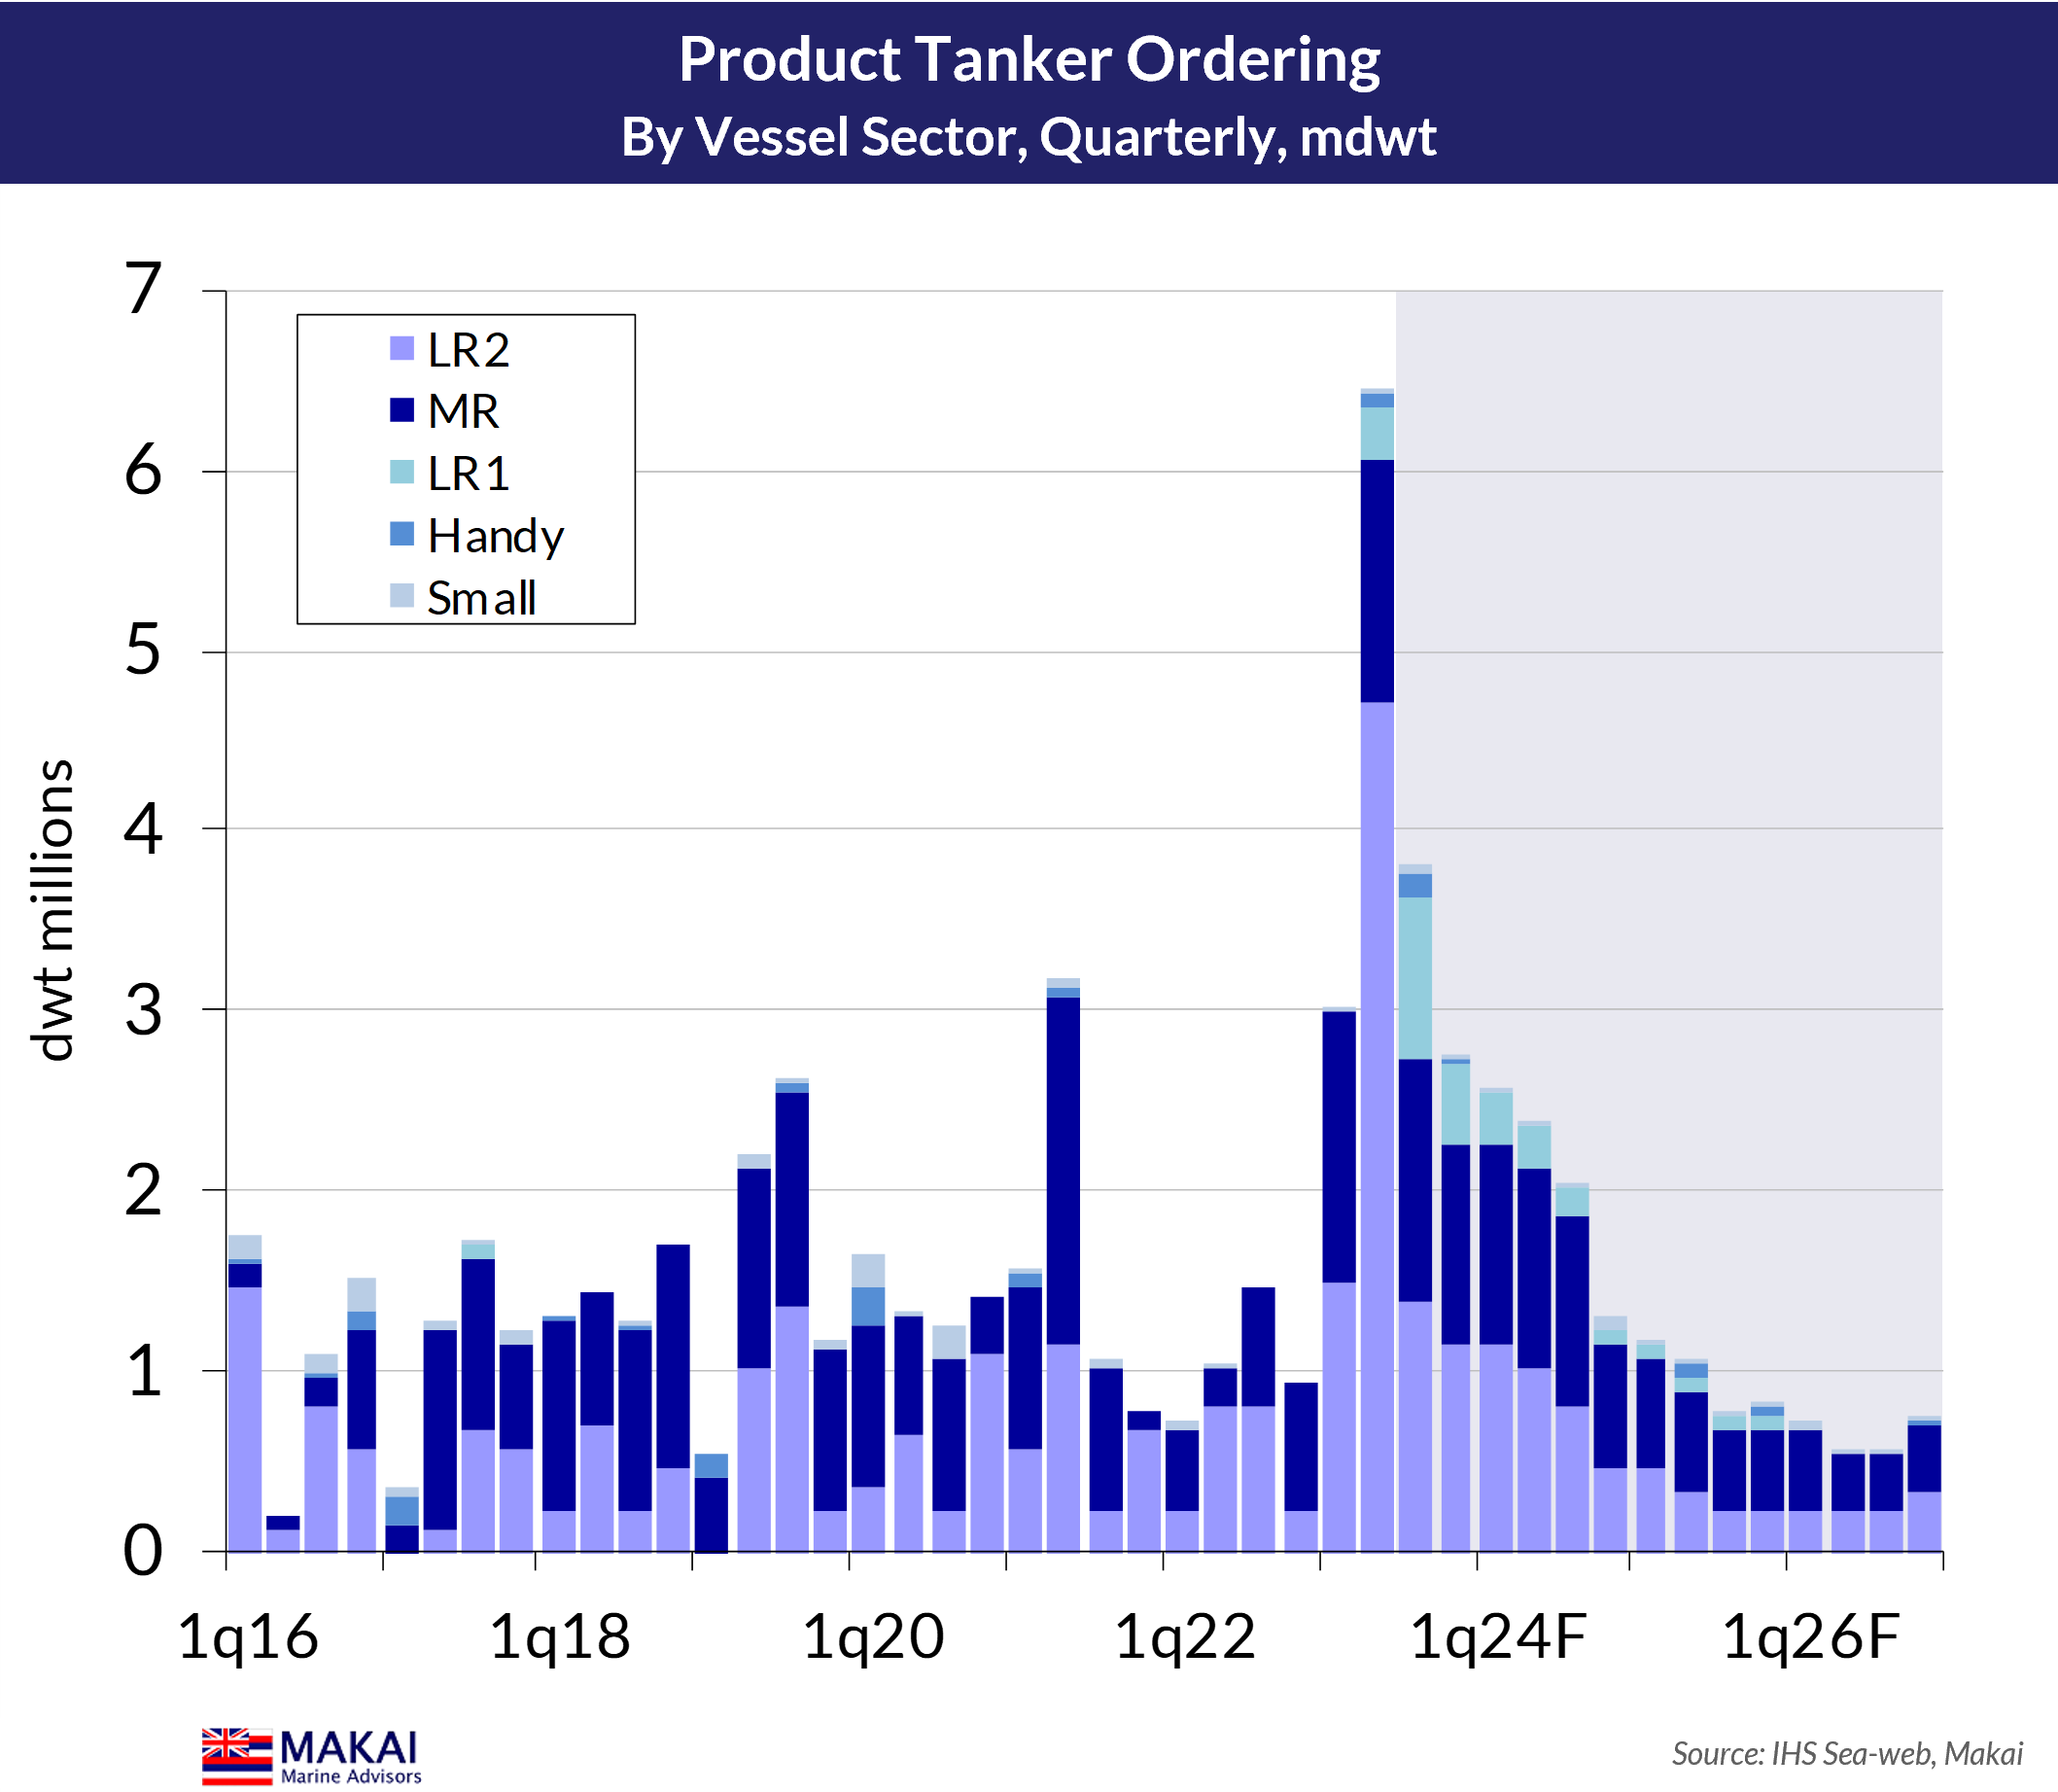
Freight market cycles are an enduring part of the shipping industry. These cycles have attracted substantial academic research over the years, but the key drivers are shipowner behaviour, the 2-3 year lag between ordering a vessel and its delivery, and macroeconomic cycles. Quite often, these three factors interact to produce some diabolical moments in the freight markets, as owners over-order tonnage at a strong point in the economic cycle and shipping demand, only to have the excess tonnage arrive 2-3 years later, at the precisely-wrong macroeconomic moment. Owner group psychology usually amplifies this dynamic, as they often indulge in herd behaviour, mimicking whatever the other owners are doing. The Greek ship-owning community is particularly prone to this phenomenon, and has led this year’s astonishing surge in clean tanker ordering (shown below), with an almost-obsessive focus on LR2 tankers.

The shipbroking research community is always complicit with this behaviour, given the critical importance of sale & purchase (S&P) commissions to broker profitability, and since clients do not order or purchase vessels without bullish outlooks. The equity sell side has joined the shipbroker chorus in perpetuating the “tanker supercycle” narrative, boosting new ordering. Ironically, for clean tankers, this dynamic has actually eliminated any possibility of a so-called “supercycle”.
Critically, market participants and investors are not differentiating between the dirty and clean tanker market outlooks, which have been diverging during the year. They are guilty of projecting several market factors that may remain legitimate for the dirty sector, but are wholly-inappropriate for product tankers. The concept of a “tanker” supercycle needs recalibration.
A key narrative misdirection is applying the limitations on large crude tanker ordering – from the shipyard capacity roadblocks created by aggressive LNG and liner ordering – onto product tankers. This includes the perception of extended delivery lags for the sector.
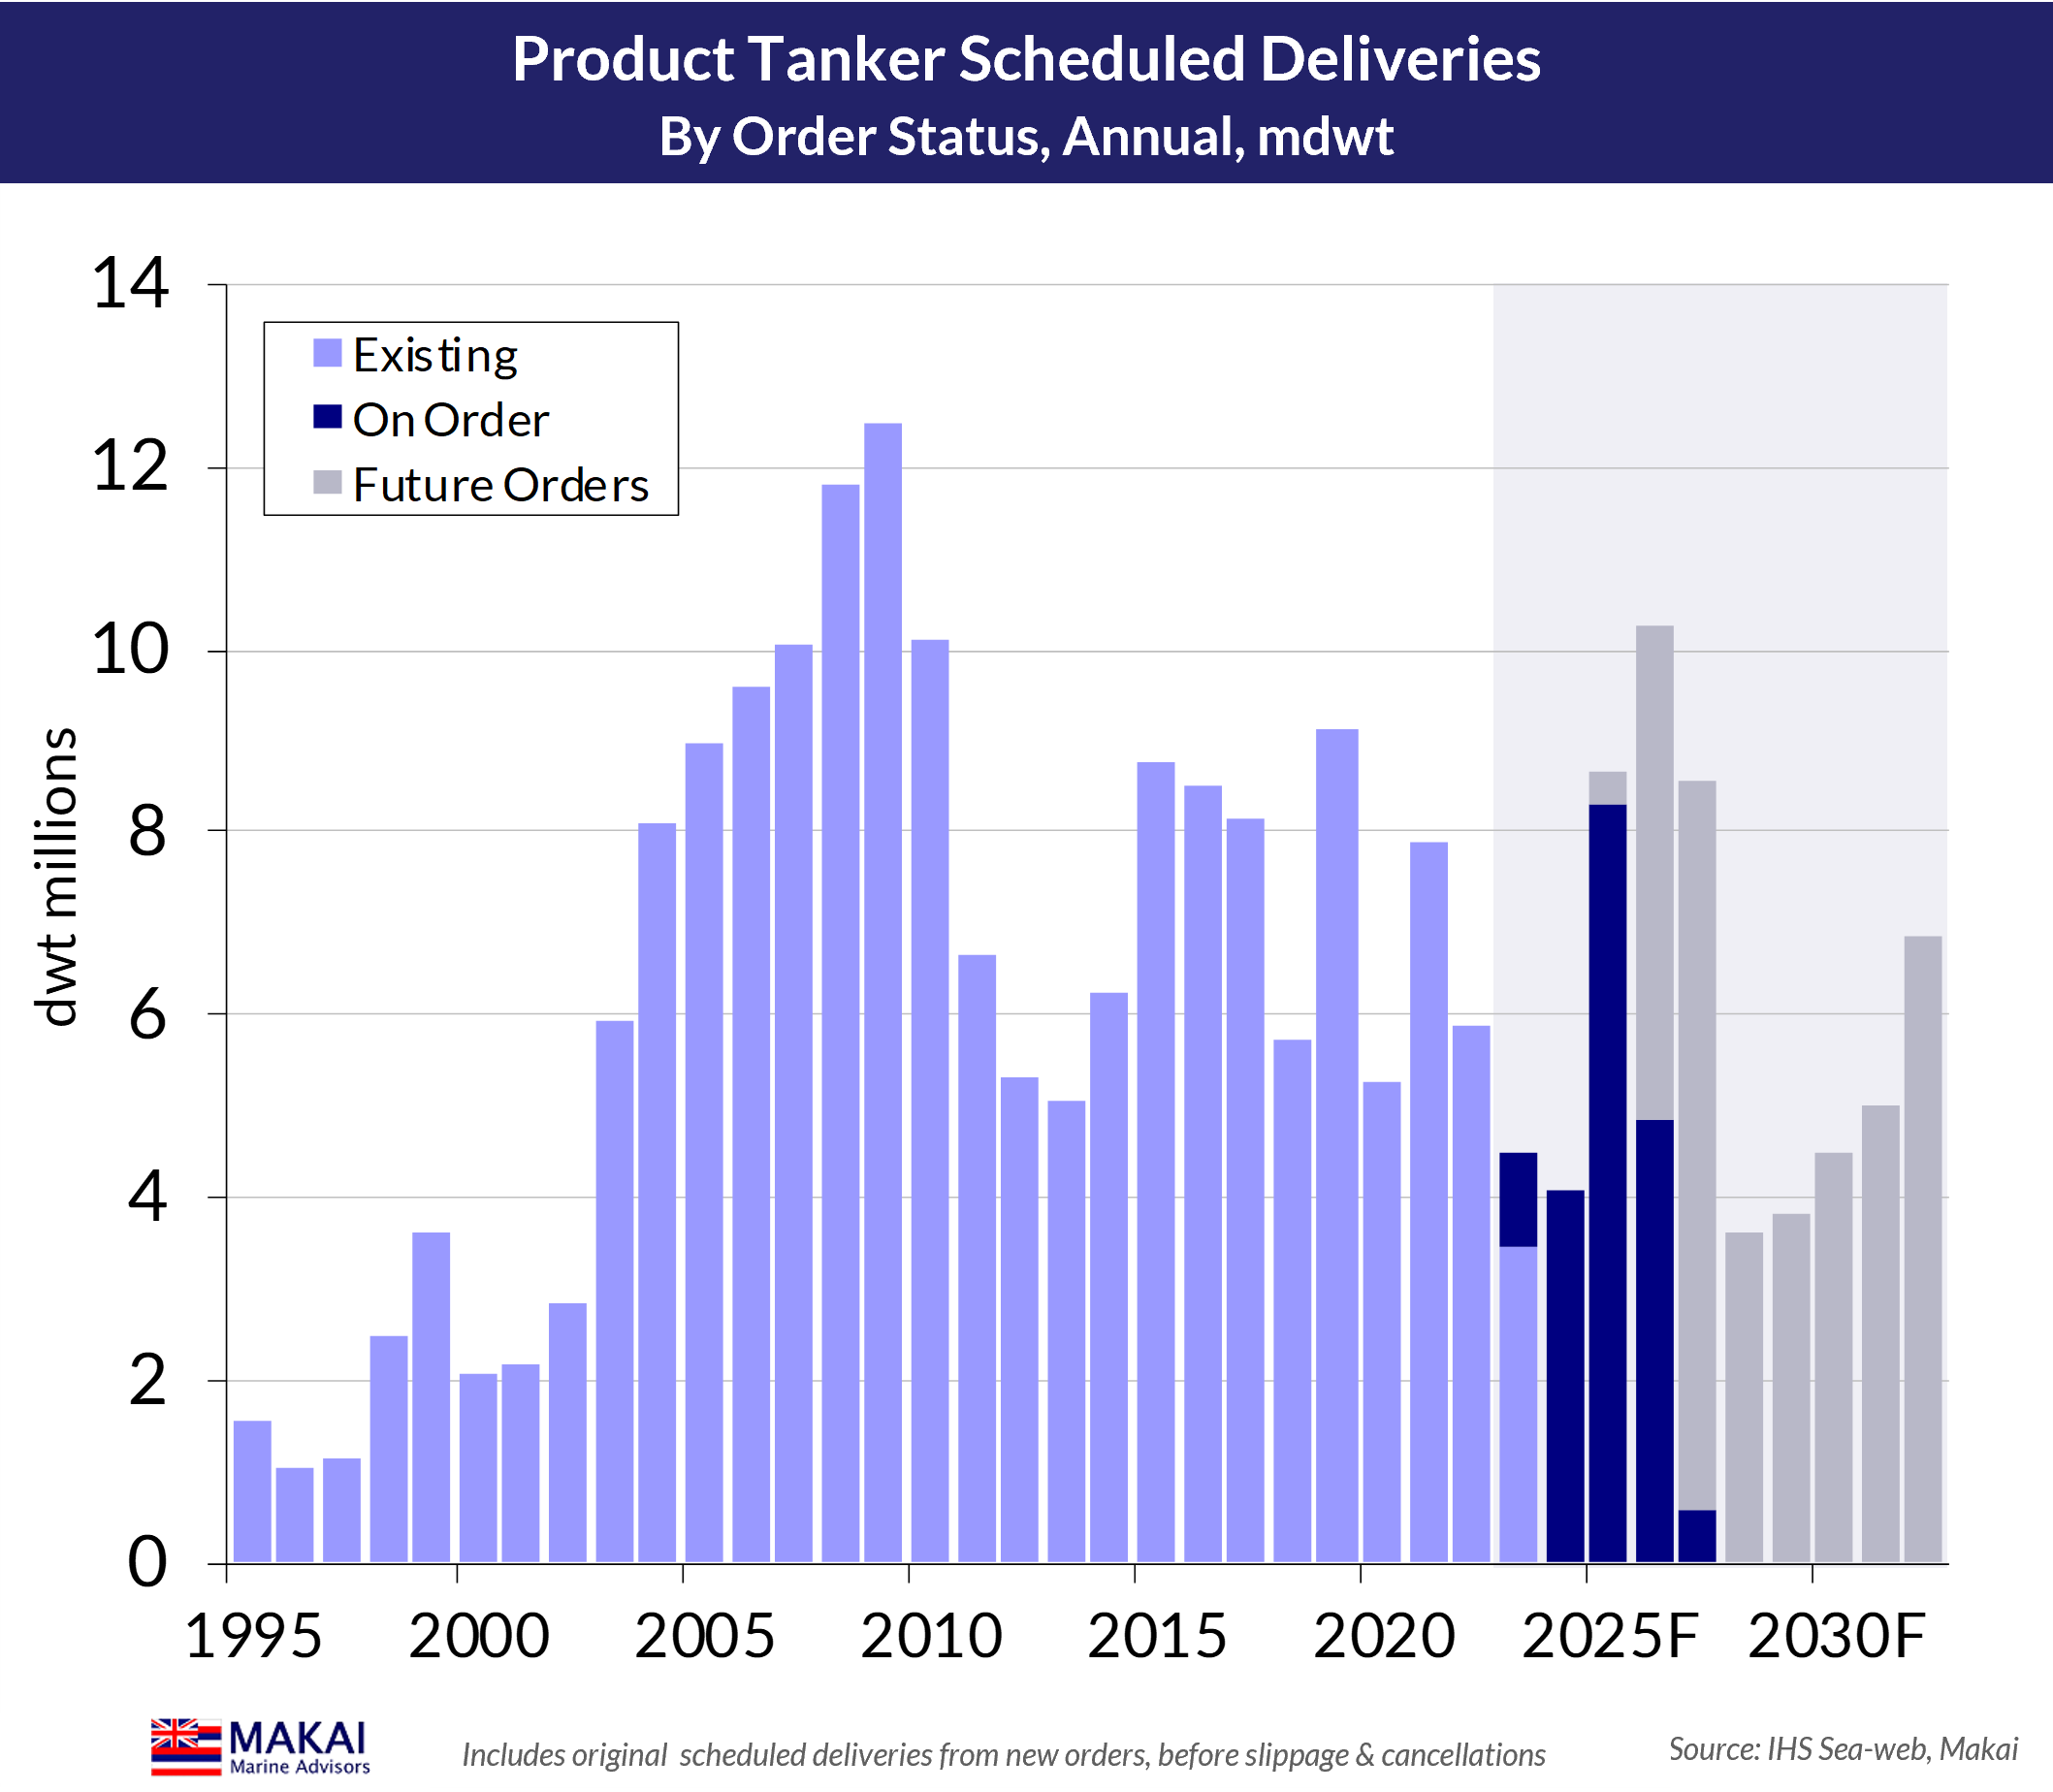
No, the shipyards that cater to product tankers have always been open for business, and the delivery lags are consistent with historical norms and this point in the ordering cycle, as shown below.
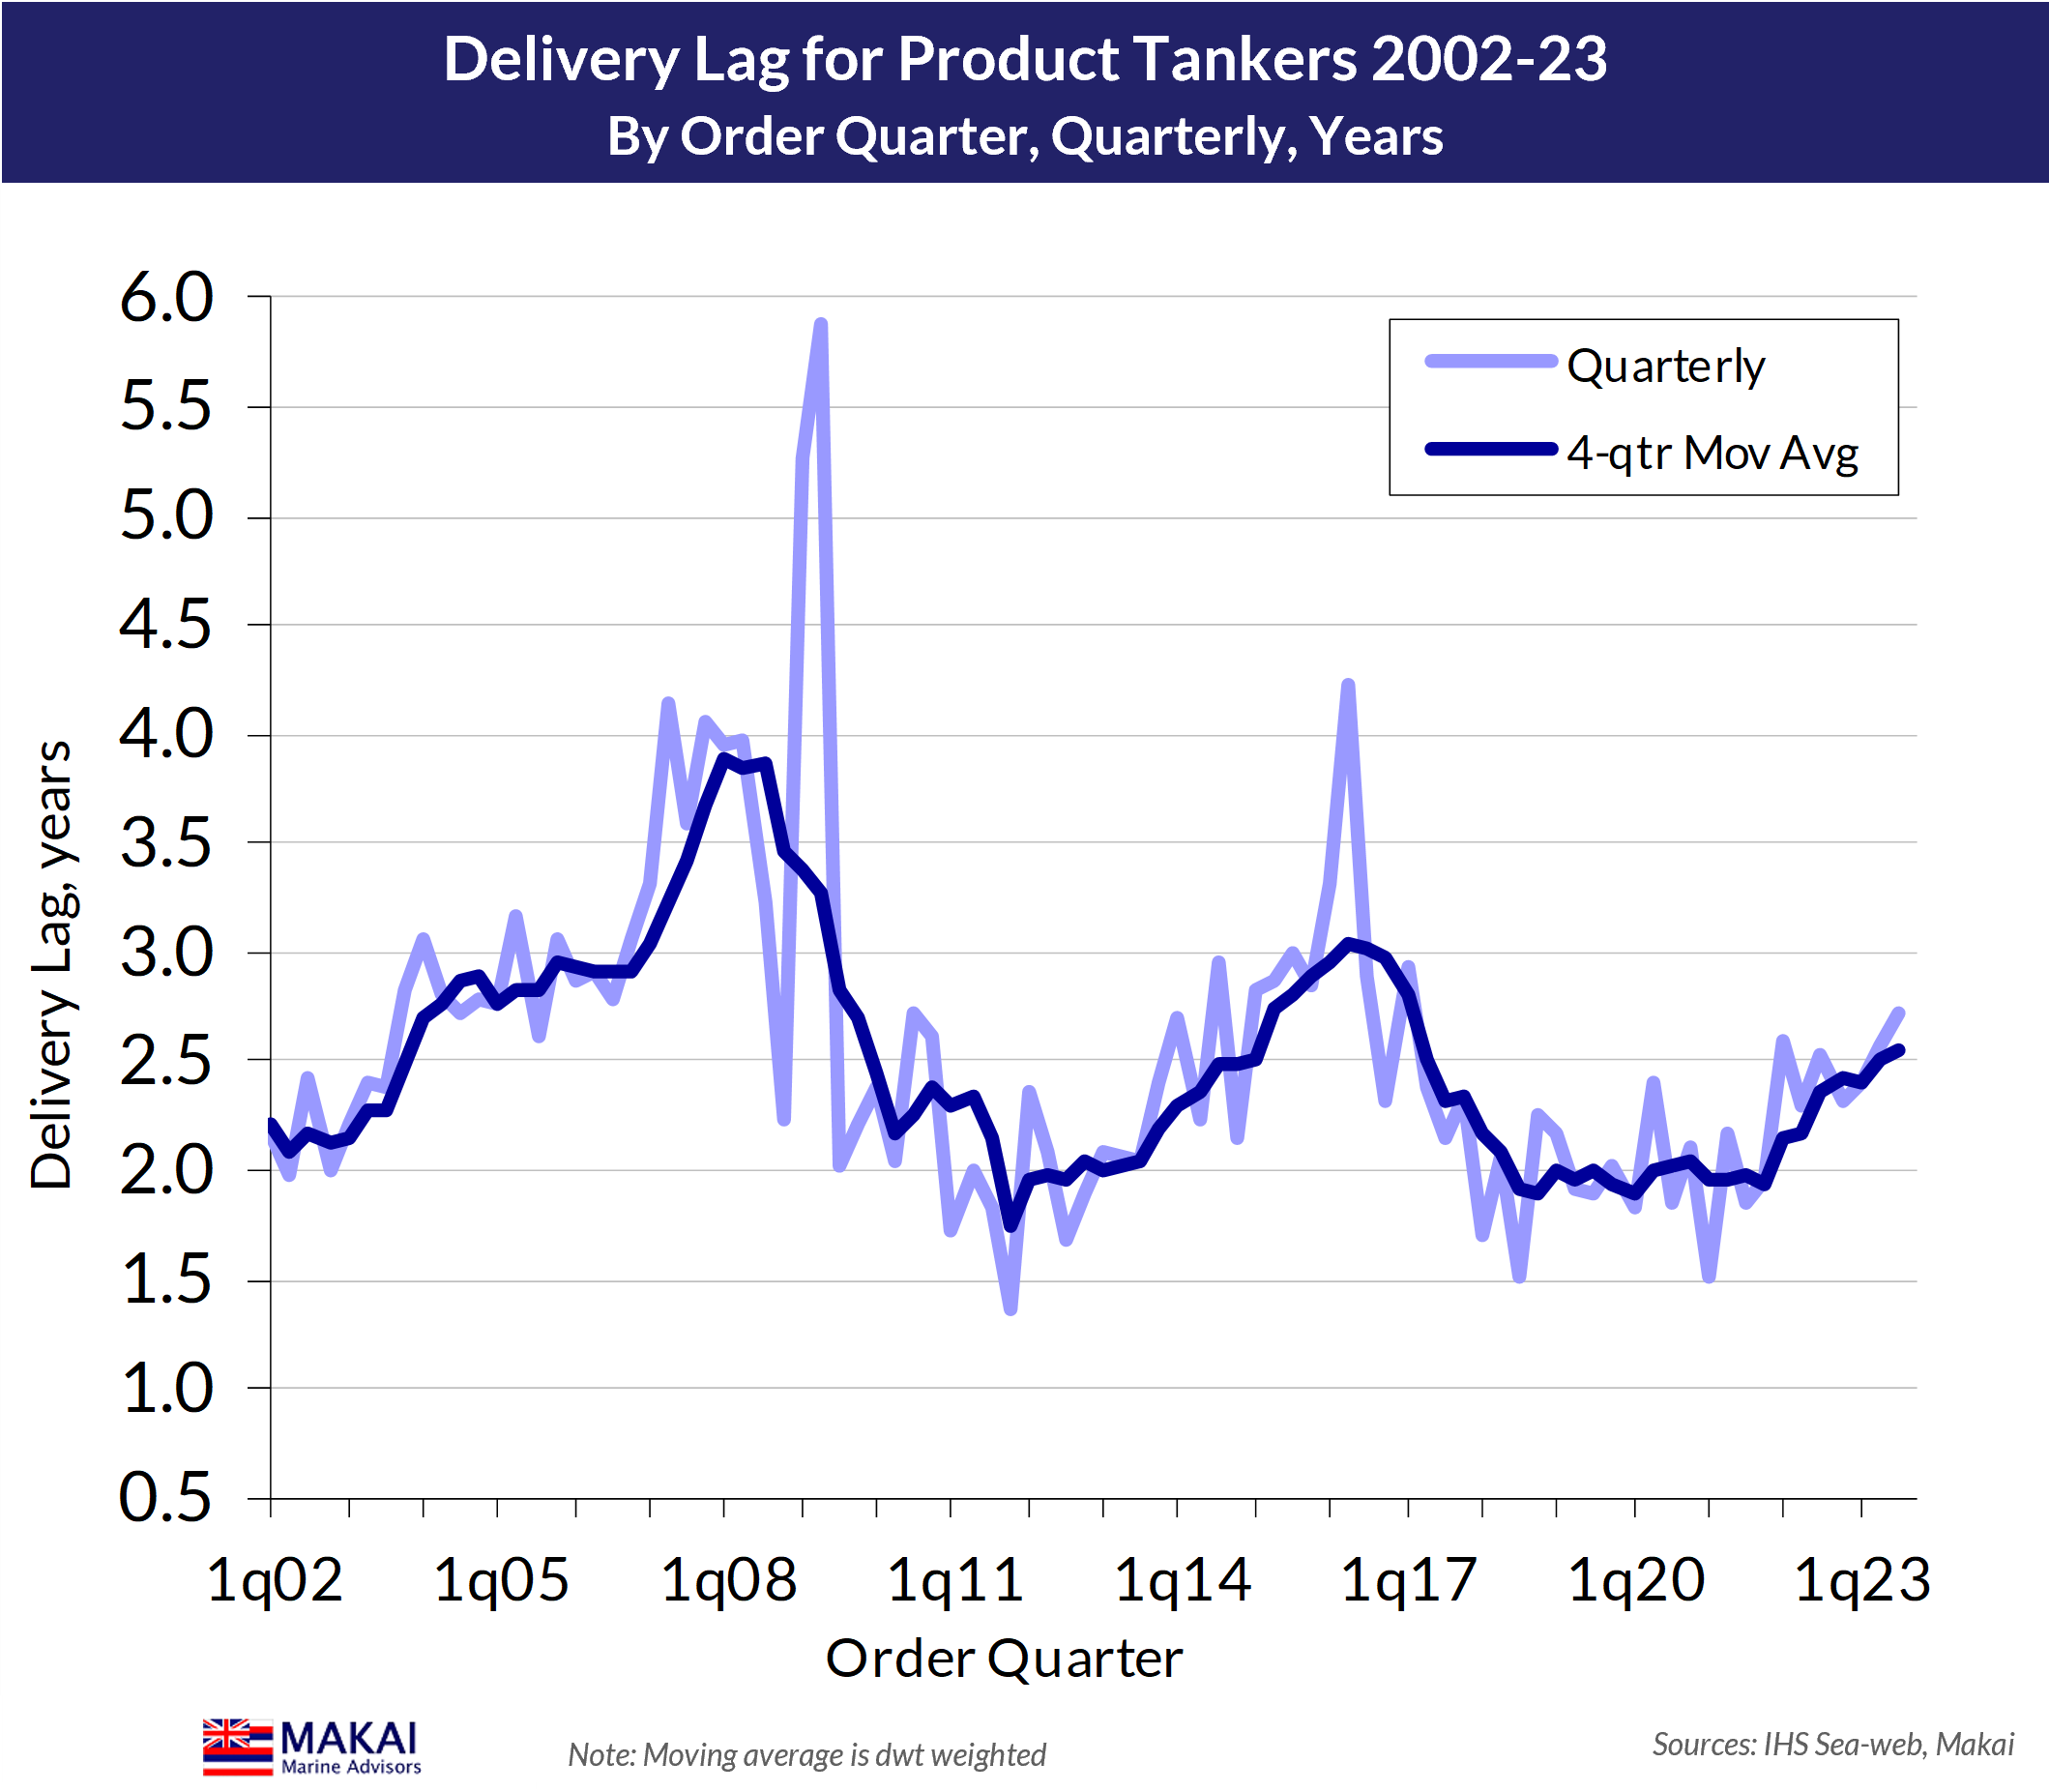
The product tanker yards can offer additional capacity for 2026 deliveries -- and with no shortage of bullish narratives circulating -- we expect owners to keep ordering, with obvious consequences.
The product tanker fleet and its chemical cousins
A key challenge to assessing the balance of the product tanker market is that it does not stand in isolation. The sector lies within a spectrum of vessels, from ordinary coated vessels than can only carry basic petroleum products to specialised chemical carriers that can handle the most hazardous chemicals. It is this interplay with the chemical tanker market that makes clean tanker demand estimation difficult, and makes it critical to understand the structure of the two fleets.
Numerous regulations govern the operation of chemical tankers, but the International Code for the Construction and Equipment of Ships carrying Dangerous Chemicals in Bulk (IBC Code) is paramount. The IBC Code provides standards for the carriage of hundreds of different chemicals and vegoils, including the IMO type tank required, ranging from IMO1 (most hazardous) to IMO3 (least hazardous within IMO standards). The IMO class of a specific tanker is then related to its volume of tank space of each type, given that individual vessels can often have different IMO type tanks.
Although the market dynamics are blurred, we do isolate specialised chemical carriers from the product tanker fleet, on the basis of IMO class, tank composition or coatings (e.g., stainless steel, zinc, epoxy) and the number of pumps and segregations. Based upon our criteria, the chemical tanker fleet represents a 17% share of the combined fleets.

Meanwhile, the International Maritime Organization (IMO) left its imprint on the chemical tanker market in 2007, with the adoption of MARPOL Annex II, that required compliance with the IBC. This tightened existing regs and expanded chemical tanker demand, most notably requiring IMO2 tanks for vegoil, as well as for some more basic chemicals. The impact on the smaller-sized product tanker fleet was profound, as owners opted for IMO-classed vessels to provide optionality and to retain access to restricted markets, as shown below.

We will address the role of these IMO-classed product tankers in the chemical markets in our next post, as well as other operating fleet adjustments, but for the moment, we will focus on the overall supply of product carriers. The following table provides our definitions of the various vessel size categories.

Ordering, as usual
If owners were reticent about ordering product tankers due to uncertainty over environmental regs and from fuel selection angst, they certainly overcame their shyness during 2q23, as they ordered 6.4 mdwt of vessels. So far in 3q23, they are on pace to order another 3.8 mdwt, having cooled their ardour for LR2s, but reigniting their love for LR1s, after spurning them for eight years.
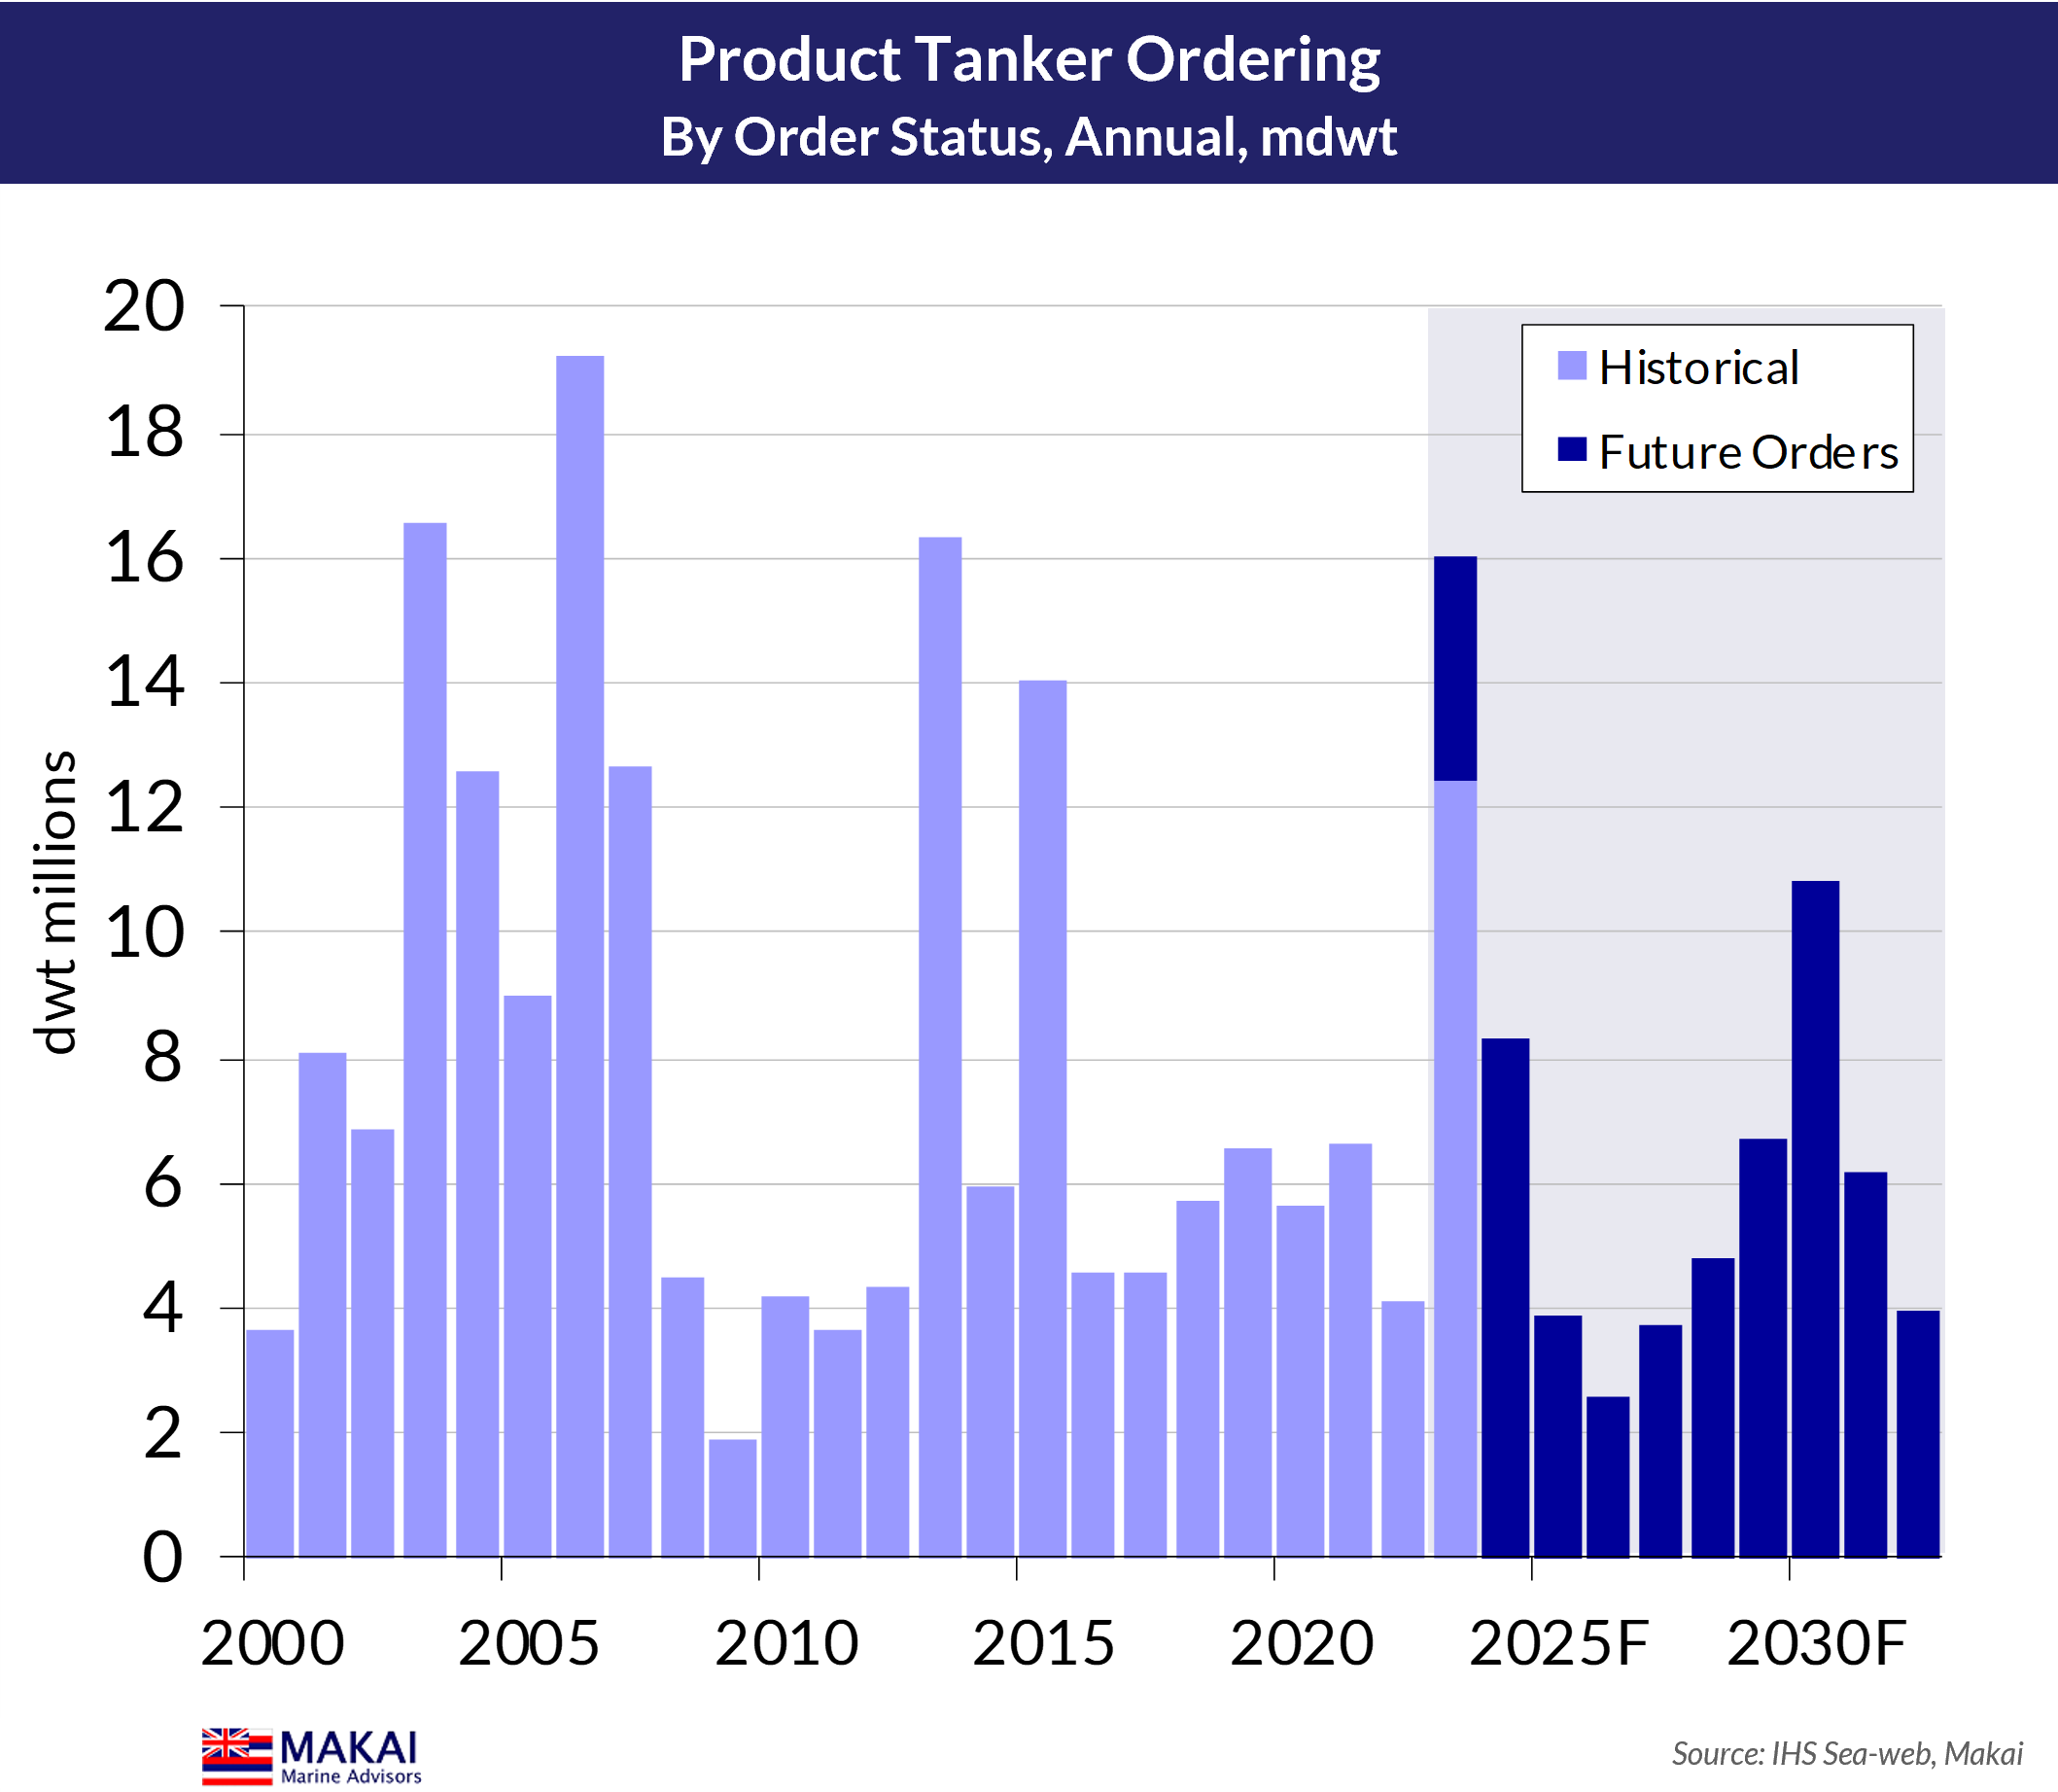
We use a variety of ordering scenarios in our fleet models, but our Base Case sees 16.0 mdwt of ordering in 2023, as shown below. We assume that owners sustain their ordering through much of 2024 (above chart), on continued bullish broker narratives, before they recognise their over-ordering.

Our forecast sees a trough in ordering on depressed earnings in 2025-27, followed by another burst in 2030, from a freight recovery. The reduction in absolute ordering at the end of the decade should be from owners finally recognising the future pace of oil demand growth and trade volumes.

Given the rapid growth in the product tanker fleet over the past 20 years, this year’s ordering seems less threatening in percentage of fleet terms (above chart), but everything is relative. The rise in 2030 ordering should remain near 5% of the fleet.

Similarly, the orderbook size as a percentage of the fleet, led by LR2s, seems less troubling in the above chart, but relative to demand prospects, it is more than adequate.
Those shipyards that were supposed to be full
Again, applying the crude tanker narrative of full shipyards to product tankers has been misguided, as the yards have responded to this year’s owner demand, after regulatory and price reticence had kept ordering at bay.

As shown in the chart above, scheduled shipyard deliveries of product tankers in 2025 is consistent with previous years, measured in Compensated Gross Tonnage (CGT). This measure is an attempt to standardise the amount of shipyard work that is required to build a certain ship, based upon coefficients applied to the vessel gross tonnage (GT), based upon its overall internal volume. Under the CGT framework, larger vessels require relatively less CGT yard capacity, on a per-dwt basis, than smaller vessels, as shown below.

The first chart also highlights the growing role of Chinese shipyards in the supply of product tankers, and the chart below shows the market share capture in recent years. The Korean share should return to typical levels in 2026, as ordering unfolds in late-2023 and 2024.

The role of new Chinese shipyards is apparent in the following chart, which shows the output of four major yards and splits the other yards into those with 2023 orders (grey) and those that did not receive orders (light blue). It underscores the loss of the excess yard capacity since the manic oversupply of 2008-09, which is a popular narrative used to suggest chronic forward undersupply. The Chinese shipbuilding industry has other ideas.
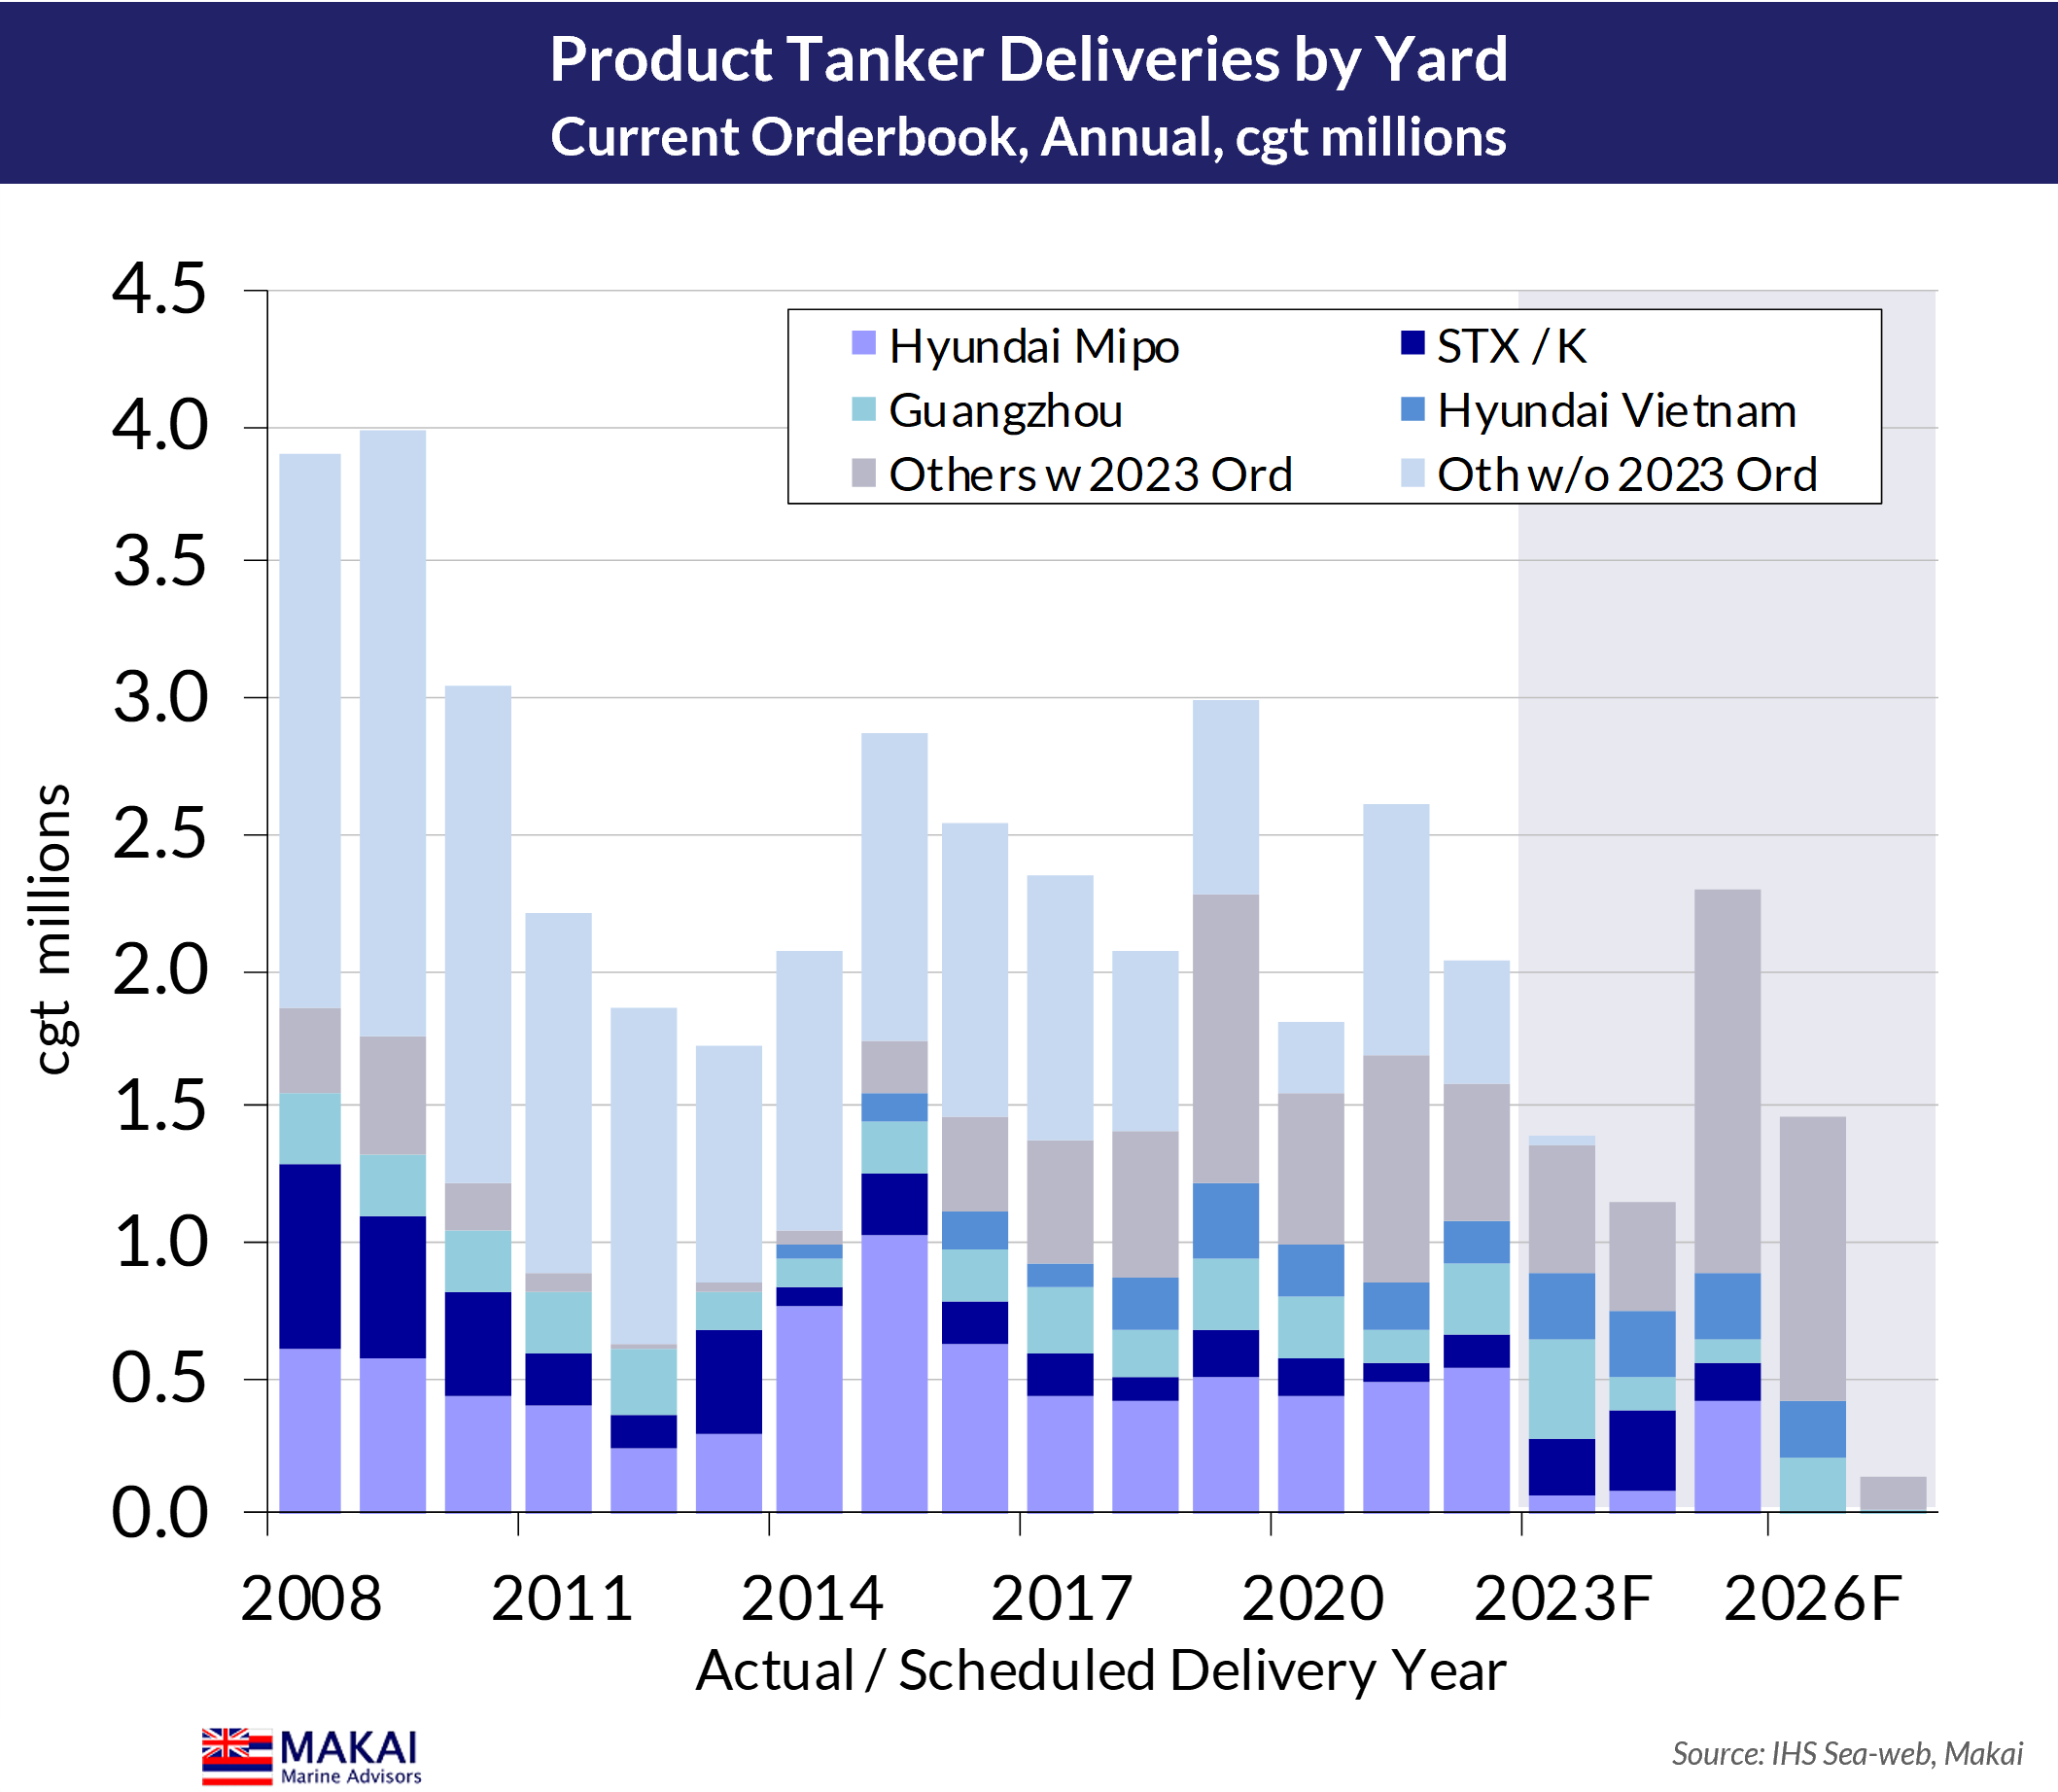
The following charts show the progress of scheduled 2023 deliveries by yard and the anticipated 2025 output, which features additional yards such as COSCO Yangzhou, Jiangsu Newyangzi and Shanhaiguan.

For the pre-eminent Korean yard, Hyundai Mipo, scheduled 2025 deliveries are more consistent with previous years, as shown in the chart below. With the average delivery lag for Mipo running at 2.2 years during 2023 (1.75 years for the first vessel in an order), it has been filling its 2025 orderbook this year, with the potential for a few more deliveries. Mipo capacity is wide open for 2026, with room for another 25-30 MRs, and we expect the fruits of that marketing effort to emerge soon.

Orders in, steel out
Our Base Case assumption is for owners to drop their pace of ordering in 4q23 and to taper it during 2024, before dropping sharply in late-2024 into 2025-26 lows, on the inevitable recognition of over-ordering.
How owners behave during the next nine months will determine where deliveries peak in 2026-27, and will reveal exactly how much additional Chinese yard capacity has become available for clean tankers during the past couple of years. Based upon delivery lags rising moderately from increased ordering activity and filling yards, this level of ordering would actually see a rise in scheduled deliveries for 2026 from 2025.
These scheduled deliveries would be before cancellations and slippage, but are based observable yard capacity from recent ordering. They feature a return to more typical levels for Hyundai Mipo MRs in 2026, and a continuation of K Shipbuilding (former STX) orders into 2026.

We do model order cancellations and ~20% delivery slippage from yards, to determine adjusted deliveries. As shown below, this still provides a jump in 2026 adjusted deliveries versus 2025, but at lower absolute levels.

When expressed in percent of fleet terms below, the potential surge in 2025-27 deliveries does not seem as daunting, given the growth in the product tanker fleet. Again, with oil demand and product trade growth slowing in the future, this level of deliveries will require more demolition to re-equilibrate the market.

Still, we can see why market participants are excited by the near-term prospects from a low level of 2024 deliveries. At 2.1% of the fleet, with a smattering of demolition activity, the actual fleet growth should be closer to 1.5%. The more relevant metric, however, is operating fleet growth, which is likely to be higher, which we will discuss in the next post in this series. Meanwhile, the equity sell side is excitedly pushing 2024 product tanker demand growth estimates of 5-6%, against zero fleet growth -- which may prove as whimsical as their EU product ban demand views last year -- given regional demand growth patterns and refinery start-ups.
Coming Next
In our second instalment of this series, we will address demolition, which is another supply element infected with over-exuberant owner and sell side narratives. Then we will discuss all of the adjustments that convert the actual fleet to the one that matters, the operating fleet.
Thank you very much. Especially Part 2 has been very interesting.
Thank you, well done 👍