


No Endless Summer
US East Coast Tanker Demand is Cresting for the Year

The US Memorial Day weekend has arrived, signalling the start of the American summer holiday season and its associated surge in seasonal air and road travel. Typically, this annual call to travel prompts a 4% jump in US gasoline demand and an impressive 8% leap in jet fuel consumption from April to summer levels. Although other Northern Hemisphere economies exhibit similar seasonality, the sheer enormity of US transportation fuel demand ensures its strong influence on global demand and trade flows. For tankers, however, activity typically precedes the actual event, and this product tanker demand influence is about to peak.
Leading the seasonal impulse are the seventeen states along the US Atlantic seaboard, collectively called PADD1 in the US Department of Energy nomenclature (from the WWII-era "Petroleum Administration for Defense" geography). After all, the region holds 37% of the country's population, 38% of Gross State Product, 34% of its vehicle registrations, and as home to JFK and other major international airports, a 37% share of US jet fuel demand. Moreover, with its gasoline demand near 3 mbpd, PADD1 was only recently eclipsed by China as the world's largest gasoline demand centre.
For all of this oil demand bravado, a decade of plant closures has left the region's refining system woefully deficient in meeting its product needs. Instead, PADD1 relies largely upon external sources, with the refineries on the US Gulf coast (PADD3) providing the vast majority of these inflows. Only when seasonal demand gains outpace PADD3 capabilities, do product imports assert a larger role, typically for gasoil in the winter and gasoline in the months preceding summer demand.
Preceding, since most of the gasoline import excitement for PADD1 occurs well before summer gasoline demand hits its crescendo, as the region usually builds stocks and contends with a switch in gasoline specifications. Then, higher summer crude runs and inflows from PADD3 arrive to meet demand. The exact timing of the peak in gasoline imports differs each year, but this year, it should be occurring in early-June, suggesting that clean tanker demand from PADD1 will be ebbing soon.

Demand Forecasting? Thanks for all the help EIA
Reaching these type of tanker demand conclusions for an individual PADD requires performing mass balances for each one, and for this, product demand forecasts by grade and PADD are essential inputs. Unfortunately, the US Energy Information Administration (EIA) offers little help. All EIA demand forecasting provided by the monthly Short-term Energy Outlooks (STEO) and Annual Energy Outlooks (AEO) are on the national level, with no PADD-specific forecasts. They provide a smattering of demographic and macroeconomic outlooks by Census Division, which do not correspond completely with the PADDs -- so the process requires analysis of data at the state level to tie to the EIA numbers. Using this state-level data and a swathe of other fundamental data is integral to developing our own PADD-specific forecasts, which should be a separate Substack post, including how we deviate from many of the EIA assumptions.
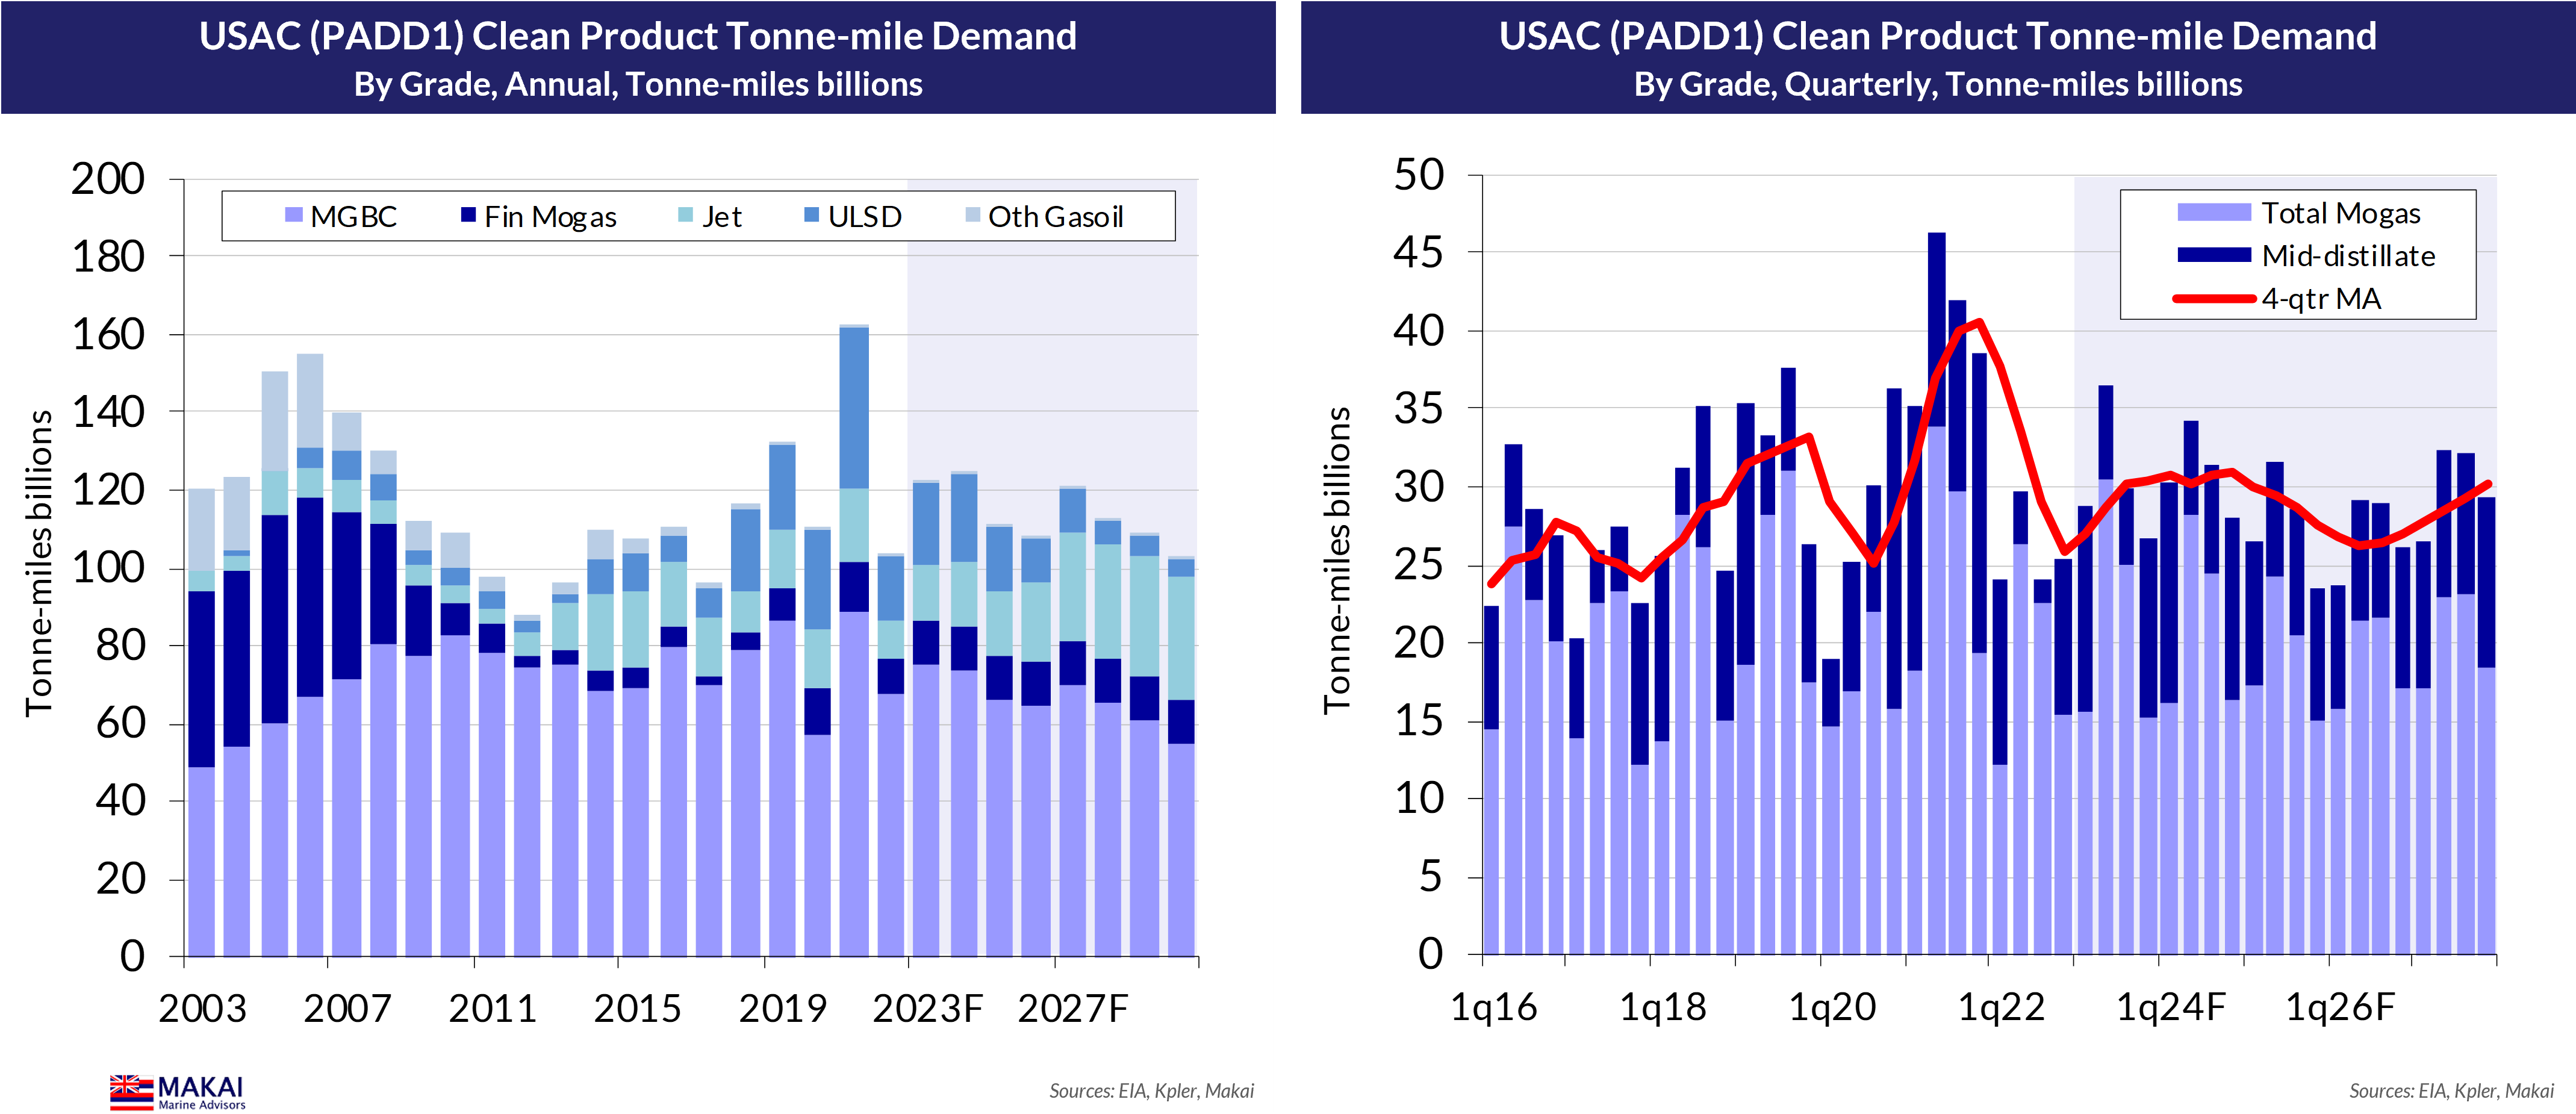
For purposes of this analysis, we have used our PADD estimates of national forecasts from the recent STEO and the EIA Reference Case from the 2023 AEO. The charts below provide the PADD1 demand forecasts from this process.

Two key observations from these charts:
PADD1 clean product demand is not returning to pre-pandemic levels, according to the EIA. Although jet fuel is still in the process of returning to those volumes, EV adoption and improved fuel economy are pressuring gasoline, while the decline in heating oil households is cutting into diesel demand. The EIA also has some fanciful notions on trucking fuel economy, which we will cover in that subsequent post.
The EIA forecast suggests that PADD1 demand will remain tepid for the next 18 months, with yoy gains in 2023 coming from resurgent jet fuel consumption and comparisons with lower summer 2022 gasoline demand hit by high fuel prices. The EIA also sees continued weak diesel demand.
These blasé current demand outlooks come after a 1.6 ppt improvement in the EIA outlook for 2023 real GDP growth since the November STEO. The agency sees a deceleration in clean product demand for 2024, despite a small uptick in growth for the year. Growth in PADD1 real gross state product should run about 30-40 bp slower than the national pace.
Refining System Ravaged
Against this 5.5 mbpd of demand, PADD1 today hosts only 0.88 mbpd of operable refining capacity, roughly half of the 1.72 mbpd of crude distillation unit (CDU) capacity in place before the global financial crisis (GFC). Dominated by cracking refineries, those that have a fluid catalytic cracking unit (FCC) or a hydrocracker (HCU) -- but no coker -- the PADD1 system was never really competitive in an increasingly-complex refining landscape. It became fashionable to blame the rash of closures from 2009-11 on the GFC and the region's lack of refining complexity, but another culprit emerged.

Of course, the less-sophisticated refineries did lead the capacity cull, with companies shedding 182 kbpd of topping refineries, which were mostly asphalt plants, and another 658 kbpd of cracking refineries. The cracking closures included the financially-troubled 335 kbpd Philadelphia Energy Solutions (PES) refinery, which suffered an explosion and fire in June 2019, leading to a second Chapter 11 bankruptcy and ultimate decommissioning.

The Covid-19 pandemic did claim one refining victim, if only temporarily. PBF Energy decided to shut down the smaller, 60 kbpd CDU at its 160 kbpd Paulsboro refinery, as well as some downstream units, at the end of 2020. The CDU restarted in September 2022, but the secondary units remain shut down. Our forecast contemplates the closure of the Trainer refinery in 2026, as PADD1 is likely to lose some capacity, as the eventual operation of the new Dangote refinery in Nigeria should depress margins in the Atlantic Basin.
Low refining complexity influenced the PADD1 closures, but the looming changes in the sulphur specs for regional heating oil ultimately delivered the death blow. Starting 2012, the state of New York began a process that would see all of the Northeast states in PADD1 migrate their heating oil specs to 15 ppm ULSD (ultra-low sulphur diesel), as shown below.

For East Coast refiners, this was a disastrous development. Until then, the 350 kbpd of regional heating oil demand provided an outlet for the higher-sulphur gasoil streams coming off of the distillation column, under little hydrotreating. Although light/sweet West African (WAF) grades dominated the PADD1 crude import slate at the time, even these grades have atmospheric gasoil sulphur contents of 1,000 ppm or more (e.g., Bonny Light at 1,200 ppm, Girassol at 2,300 ppm).

This left PADD1 refiners with unpalatable choices. Either spend billions of dollars on additional diesel hydrotreating capacity, or import more ULSD, while seeking export outlets for higher-sulphur grades at low netbacks. For a few refiners, putting more money into marginally-competitive refineries was unacceptable, and shutdowns ensued.
Glorified Blending Centre
Following all of this refining carnage, PADD1 is even more dependent upon external sources for meeting its product demand needs. Still, even during their halcyon days before the GFC, PADD1 refiners only met 26% of the region's product consumption -- versus the diminished 15% share today. Despite all of the discussion of PADD1 as a refining centre over the years, it was never more than a sea of tank farms in search of a refinery.

As shown in the left chart below, pipeline flows from PADD3 dominate the external sourcing. This features the Colonial Pipeline, with its Line 1 capable carrying 1.5 mbpd of finished gasoline and motor gasoline blend components (MGBC), and its Line 2 that can transport up to 1.2 mbpd of mid-distillates. The Colonial Pipeline runs from Houston to Greensboro NC, with 1.4 mbpd of extensions into the Washington DC and NYC areas. In addition, the 700 kbpd Plantation pipeline runs partially in parallel to the Colonial, from Baton Rouge to Virginia. Meanwhile, Jones Act vessels provide another 650-700 kbpd of clean supplies to PADD1, but these are almost all delivered to Florida, which has limited access to the key pipelines. Finally, PADD2 also provides product to PADD1, now in slightly higher quantities, following the partial reversal of Buckeye's Laurel pipeline from Philadelphia to Pittsburgh in 2019.

The above right chart highlights that the external sourcing by grade is roughly proportional to their share of demand, but MGBC dominate the inflows of gasoline products. This reflects how PADD1 and the rest of the country source their finished gasoline, as shown in the below chart on the left. Overwhelmingly, blenders produce the finished gasoline for the final market, with only tiny shares from refiners, imports and transfers. In order to accomplish this, PADD1 blenders rely on external sources for their MGBC -- both from PADD3 and from imports, as shown in the right chart. It also illustrates the role of ethanol in gasoline blending, with its current 10% share.
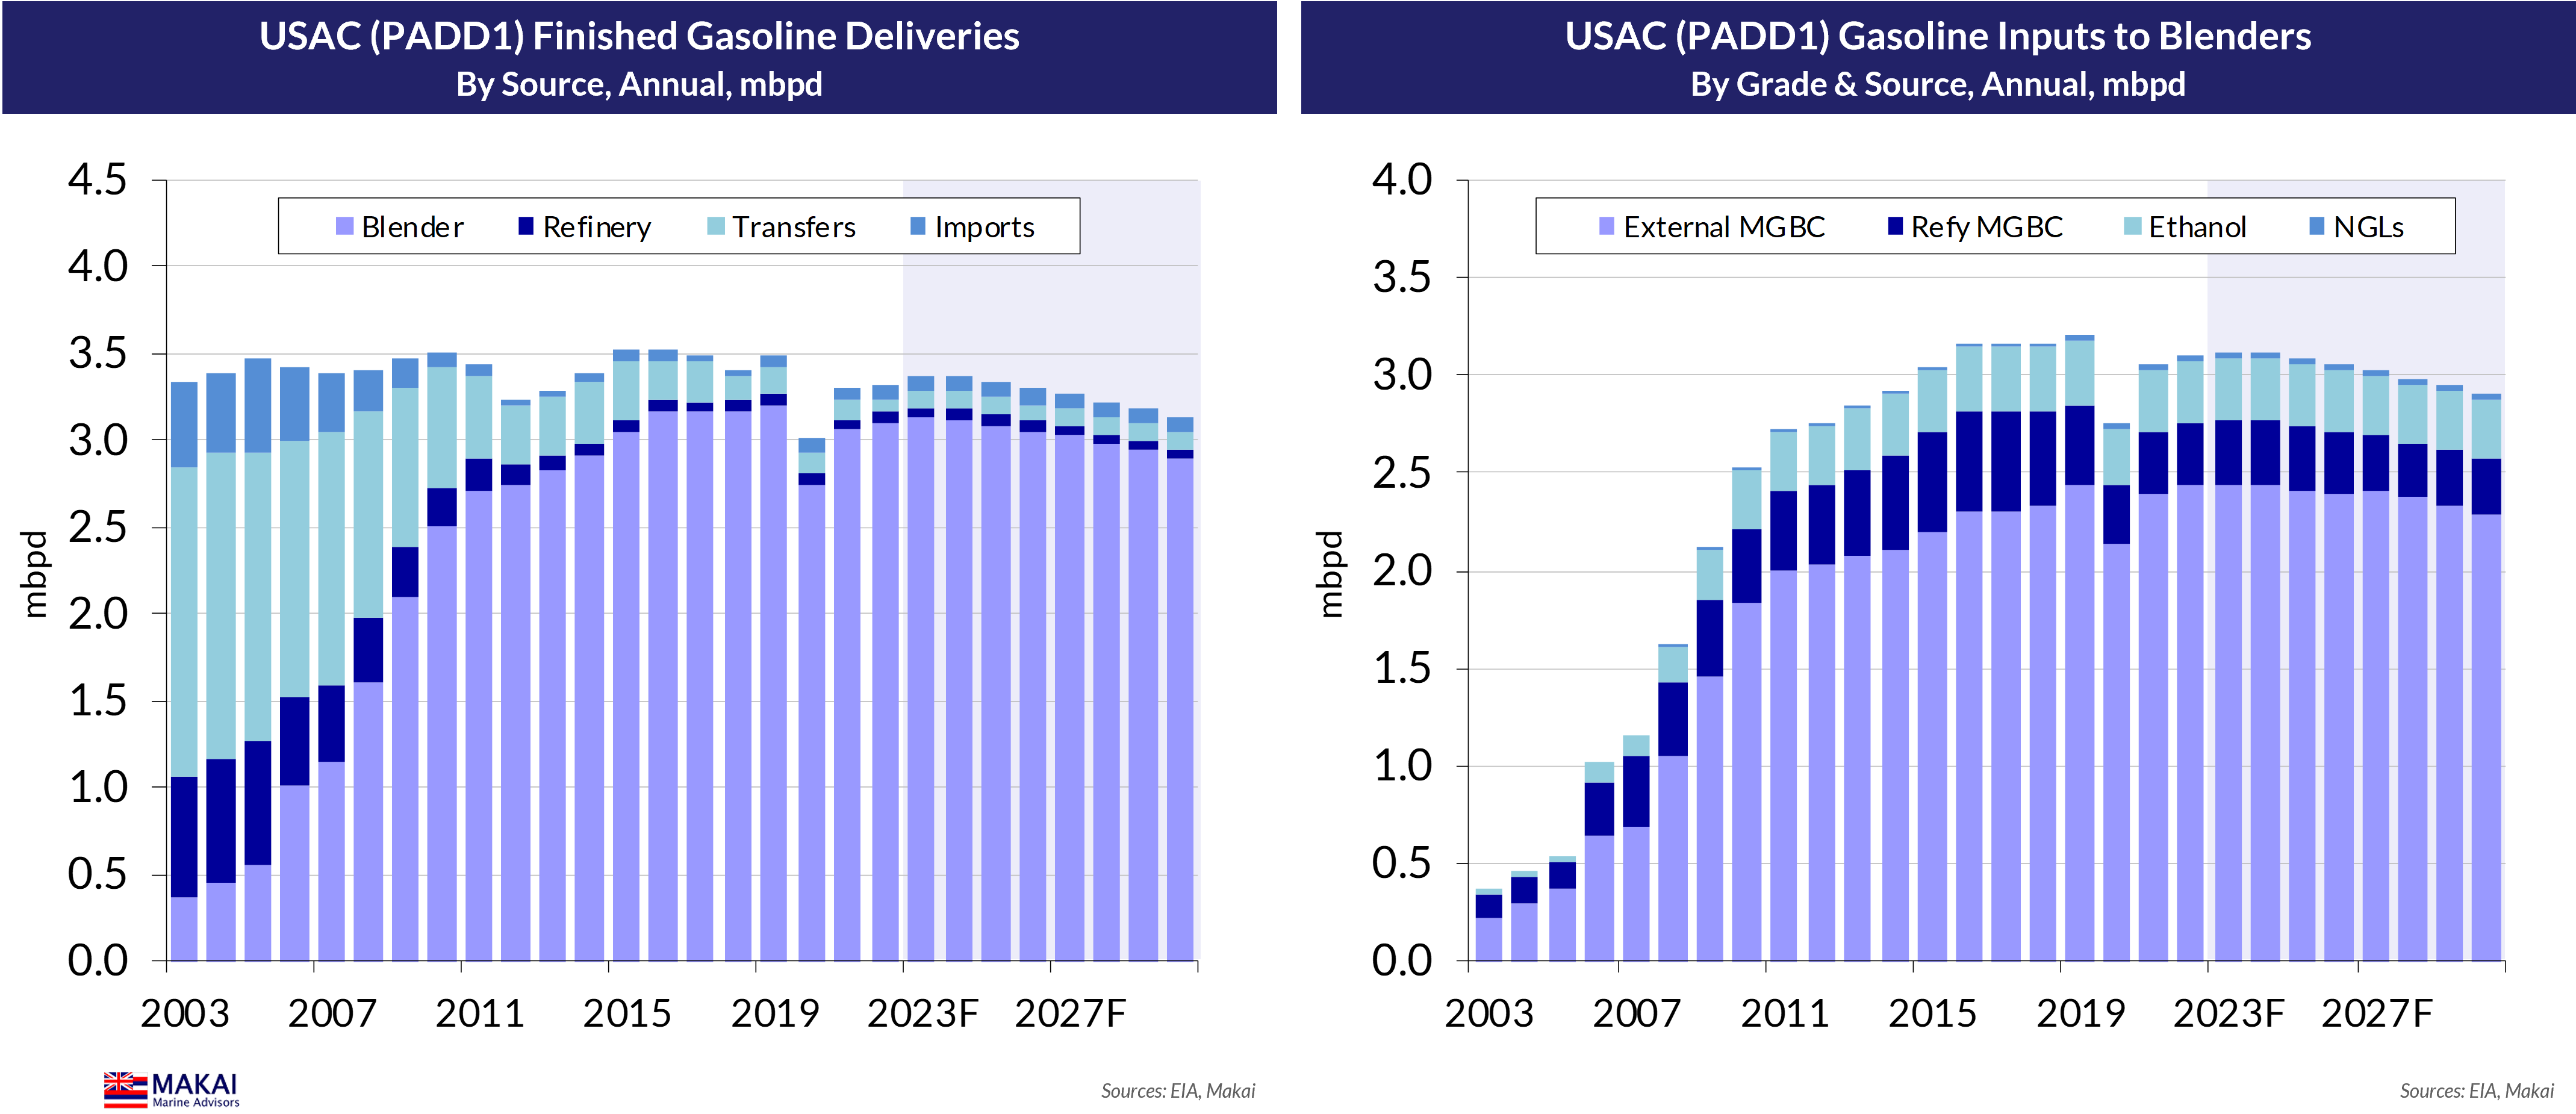
In fact, the remarkable shift to blender production starting in 2006 was a consequence of the US Congress passing the Energy Policy Act of 2005, which established the Renewable Fuel Standard (RFS). The standard set a minimum volume of renewable biofuels to be blended into the transportation fuel supply, but also removed liability protection for MTBE (methyl tertiary butyl ether). Refiners had been using MTBE as an octane additive, later found to be a suspected carcinogen in ground water contamination. MTBE had also been a key ingredient in the production of reformulated gasoline (RFG), required in certain US metropolitan areas to reduce air pollution. With MTBE effectively banned, refiners were forced to use ethanol, with its high octane number, as the oxygenate added to RBOB (Reformulated Gasoline Blendstock for Oxygenate Blending) to produce RFG.
The use of ethanol, also mandated by the RFS, has its operational challenges. Ethanol is extremely hydroscopic, meaning it bonds with water easily, potentially causing the gasoline portion to separate from the ethanol/water mixture. This characteristic, along with being highly corrosive, prevents it from pipeline transport, requiring ethanol suppliers to ship the product predominantly by rail. Moreover, ethanol's fondness for water also limits storage flexibility, preventing most refineries from performing final blending on site. Instead, ethanol blending with RBOB -- or CBOB (Conventional Gasoline Blendstock for Oxygenate Blending) outside of RFG areas -- takes place at the blenders' terminals before truck transport. For these reasons, blenders are the overwhelming source of finished gasoline deliveries in the nation's supply chain.
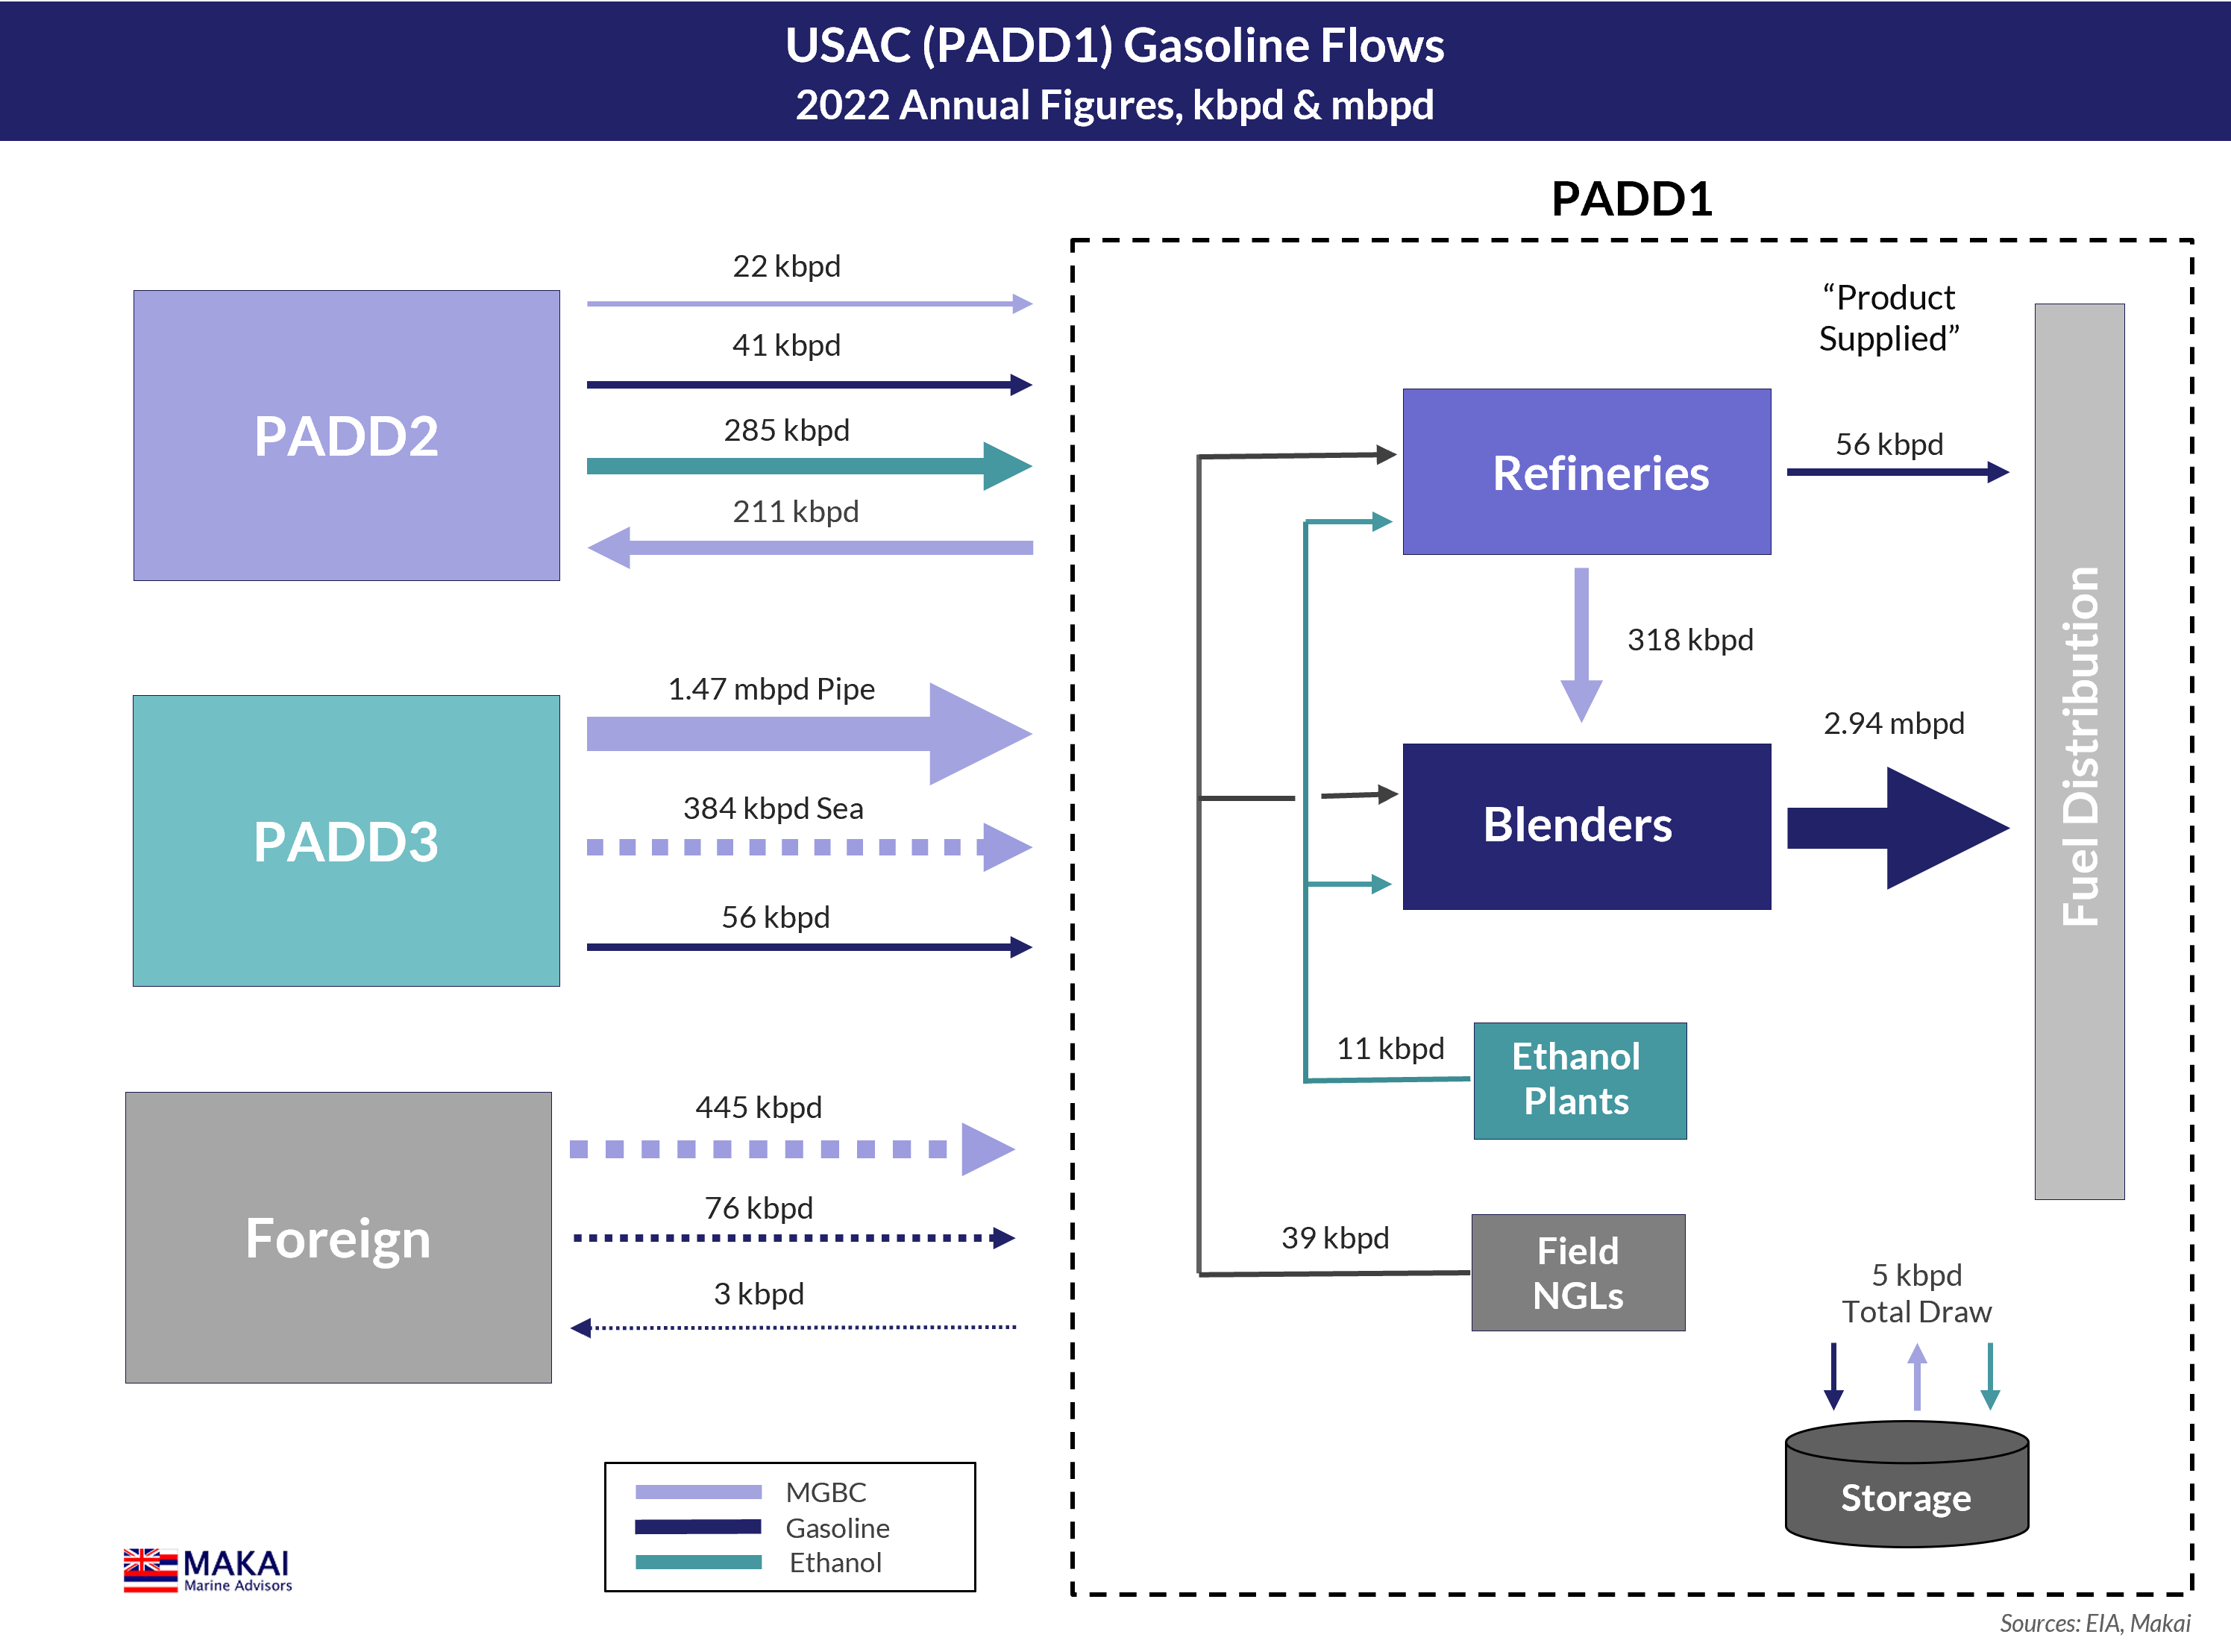
The simplified flow chart above, with 2022 data, underscores the dependency of PADD1 on external sources for meeting its 3 mbpd of gasoline demand. The inflows are predominantly MGBC that flow directly into the blenders' facilities, but included 285 kbpd of ethanol rail transport from PADD2.
Making it Balance
The above flow chart also introduces some of the variables involved in generating trade forecasts for a region. As shown in the diagram below, the models calculate the imports required to meet a certain level of inventories on targeted days of demand, for a grade that is imported.
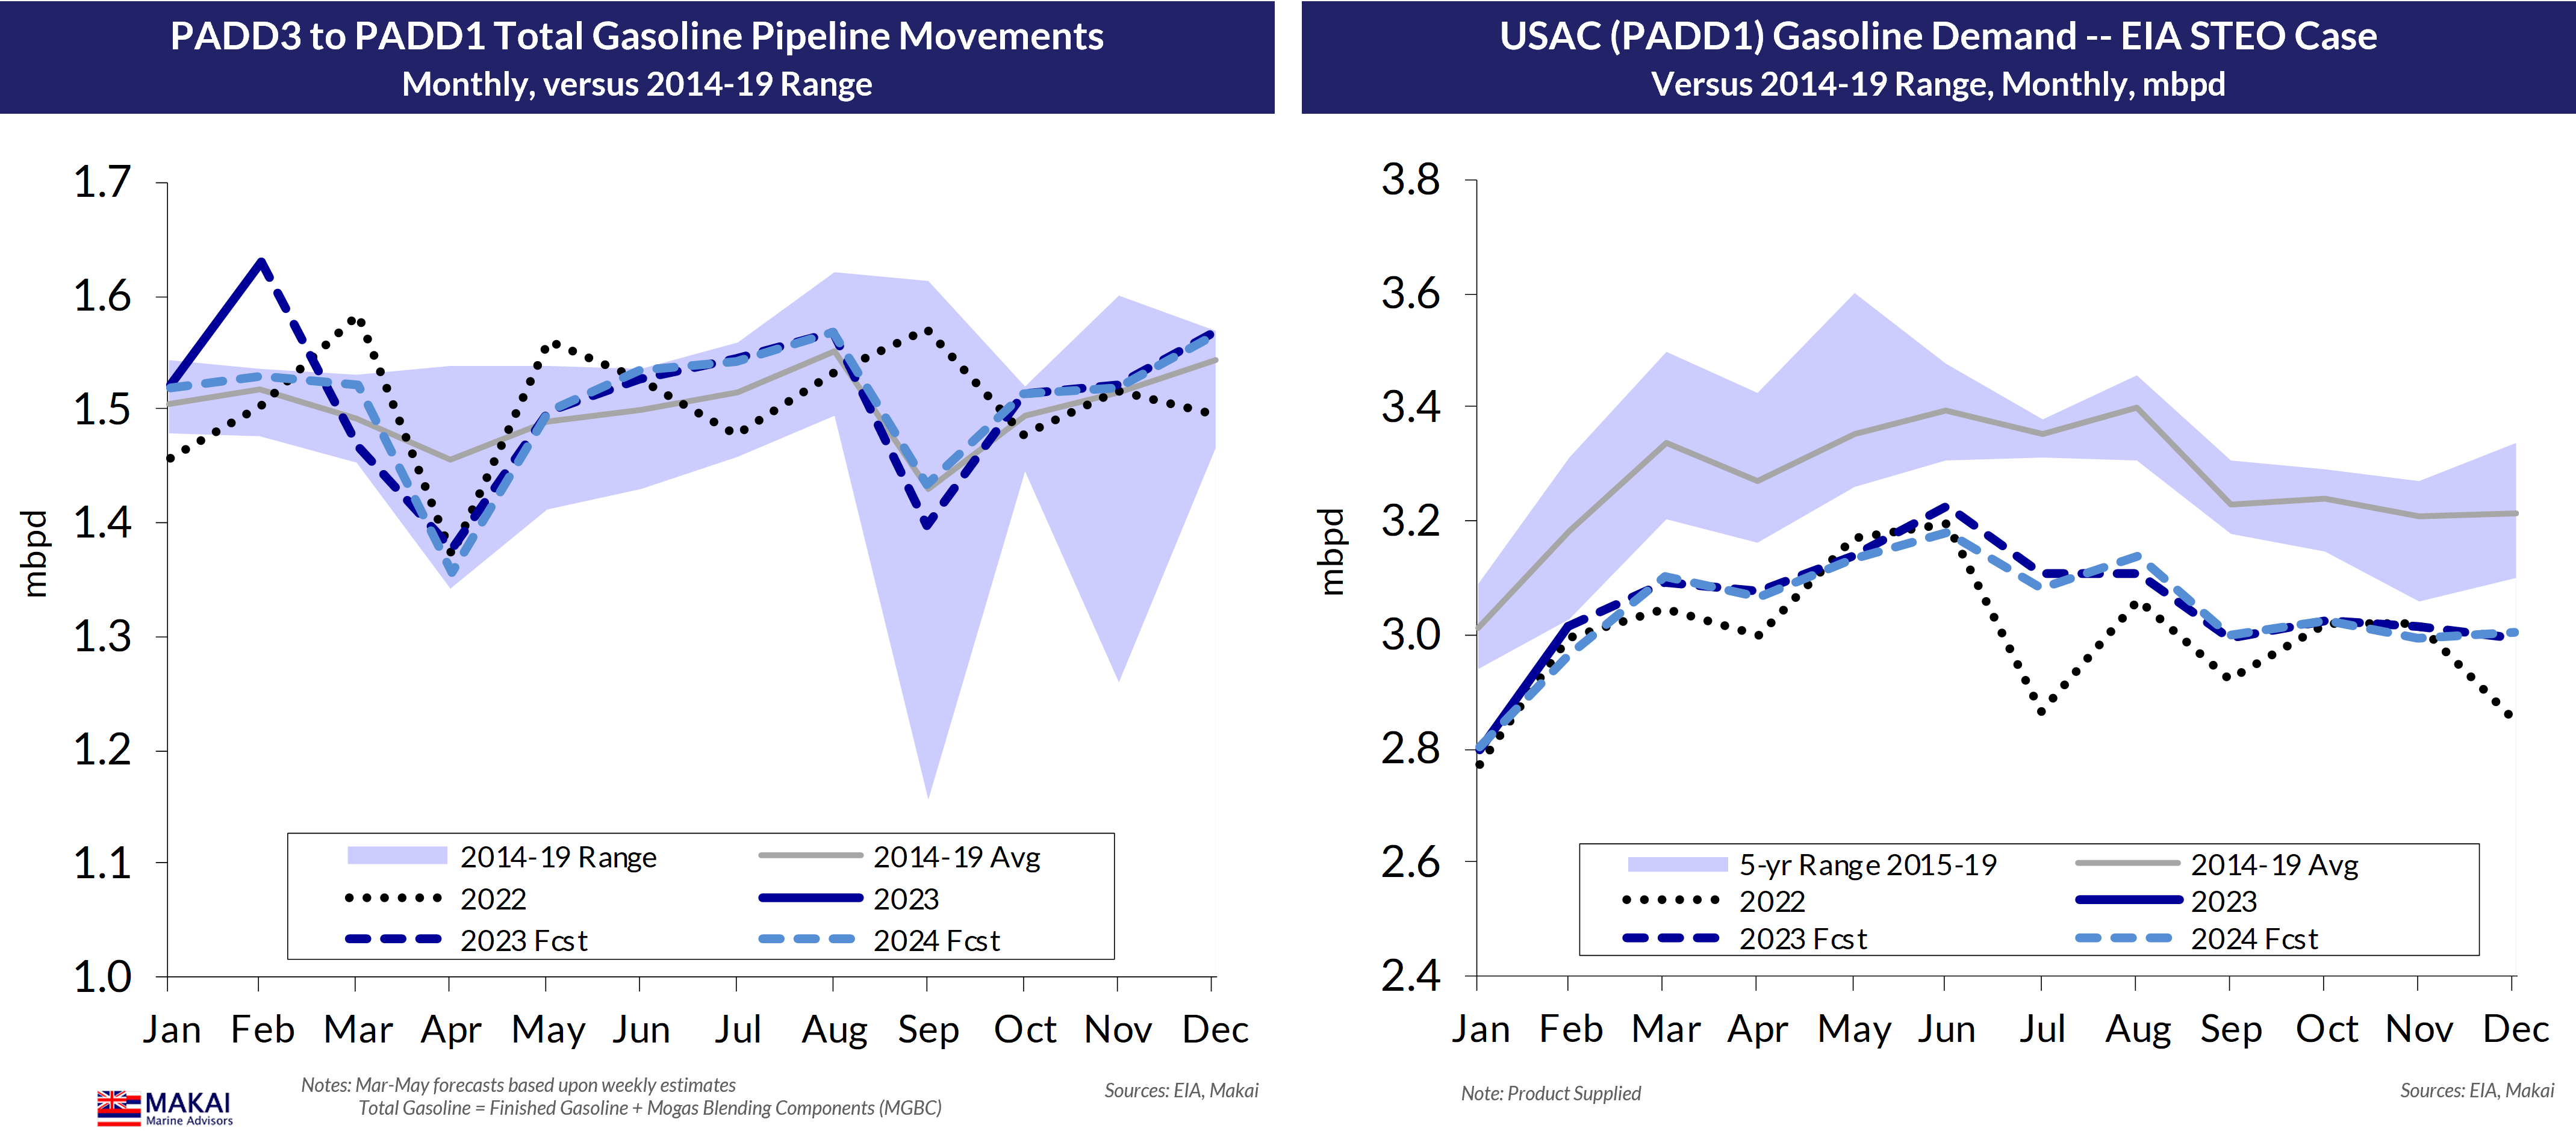
The modelling depends upon assumptions for all of the other variables in the equation, but many of them are small and consistent. In other regions, refining forecasts can play a major role, but not in PADD1, where demand and PADD3 inflows are the biggest influences on the balance. As shown in the left chart below, clean product pipeline inflows from PADD3 have recovered from their pandemic trough and are hitting their previous capacity constraints near 2.7 mbpd. Similarly, the models assume that seaborne movements from PADD3 are constrained by the current Jones Act fleet of tankers and Articulated Tug Barges (ATB) near 650 kbpd.

These constrained inflows from PADD3 suggest that demand will be the dominant influence on future PADD1 clean imports, with declining gasoline and diesel demand offsetting rising jet fuel import requirements. The spike in imports during 2021 (shown below) reflected the recovery in demand, but a slower rise in PADD3 crude runs. The assumed loss of the Trainer refinery in 2026 prompts the small rise in 2027 imports, but the general direction of imports is flat-to-declining.
Near-term Outlooks by Grade
Refining may play a smaller role in PADD1 product balances than other regions, but it is not irrelevant. The following charts show the expected refining performance through 2024, with utilisations expected to remain lower in 2023 and within the 2014-19 range. Crude intake remains 25 kbpd higher than 2022, however, with the return of the Paulsboro CDU.

Gasoline is the current source of excitement for the moment, but this is set to change, as the seasonal import surge should start to subside in late-June and drop in July (bottom right chart). Pipeline inflows from PADD3 should continue their seasonal rise during the summer (centre left), while national demand in the STEO is exhibiting an unusual late-summer pattern for 2023 (centre right). This year, the models include a more-typical September drop in receipts from PADD3, from a normal hurricane season. Days of mogas inventories, which drive the import forecasts, remain at recent levels, with a slight rise in 2024 (bottom left). The flat inventories are obscuring the switch from winter-grade to summer grade gasoline required for refiners and blenders by 01 May each year. Summer grade gasoline has lower volatility requirements (along with RFG), limiting high-octane butane in the blends, making summer grade more difficult to produce. Much of the seasonal rise in PADD1 mogas imports is the region relying on European refiners to build summer grade stocks.


Jet Fuel -- While the EIA summer gasoline forecast is a bit wobbly for 2023, its national jet fuel outlook is almost parabolic through June. The PADD1 region has pronounced seasonality patterns for jet fuel, but should see a 8.7% jump in jet demand in 2023 (centre right chart below). The EIA weekly data suggests a sharp drop in jet yields during May, which we expect to return to seasonal norms (upper left). Meanwhile, jet inventories have jumped by 3 million barrels (MB) during April & May, suggesting a lower import need during the summer, despite higher demand (lower right).


Diesel -- Northeast winter heating oil demand drives ULSD seasonality in PADD1, with demand currently in its summer lull, until distributor and home stock-building starts in October, and actual consumption rises through winter (centre right chart). Transfers of ULSD from PADD3 have remained subdued this Spring, as inferred from the weekly data (centre left), which has allowed inventories to slip from their February jump on higher imports and transfers (lower left). Again, refiners and distributors seem content to leave stocks at low levels, but we have modelled some builds for 2024. These stock movements leave ULSD imports at their usual June nadir (lower right), before rising in the Autumn.


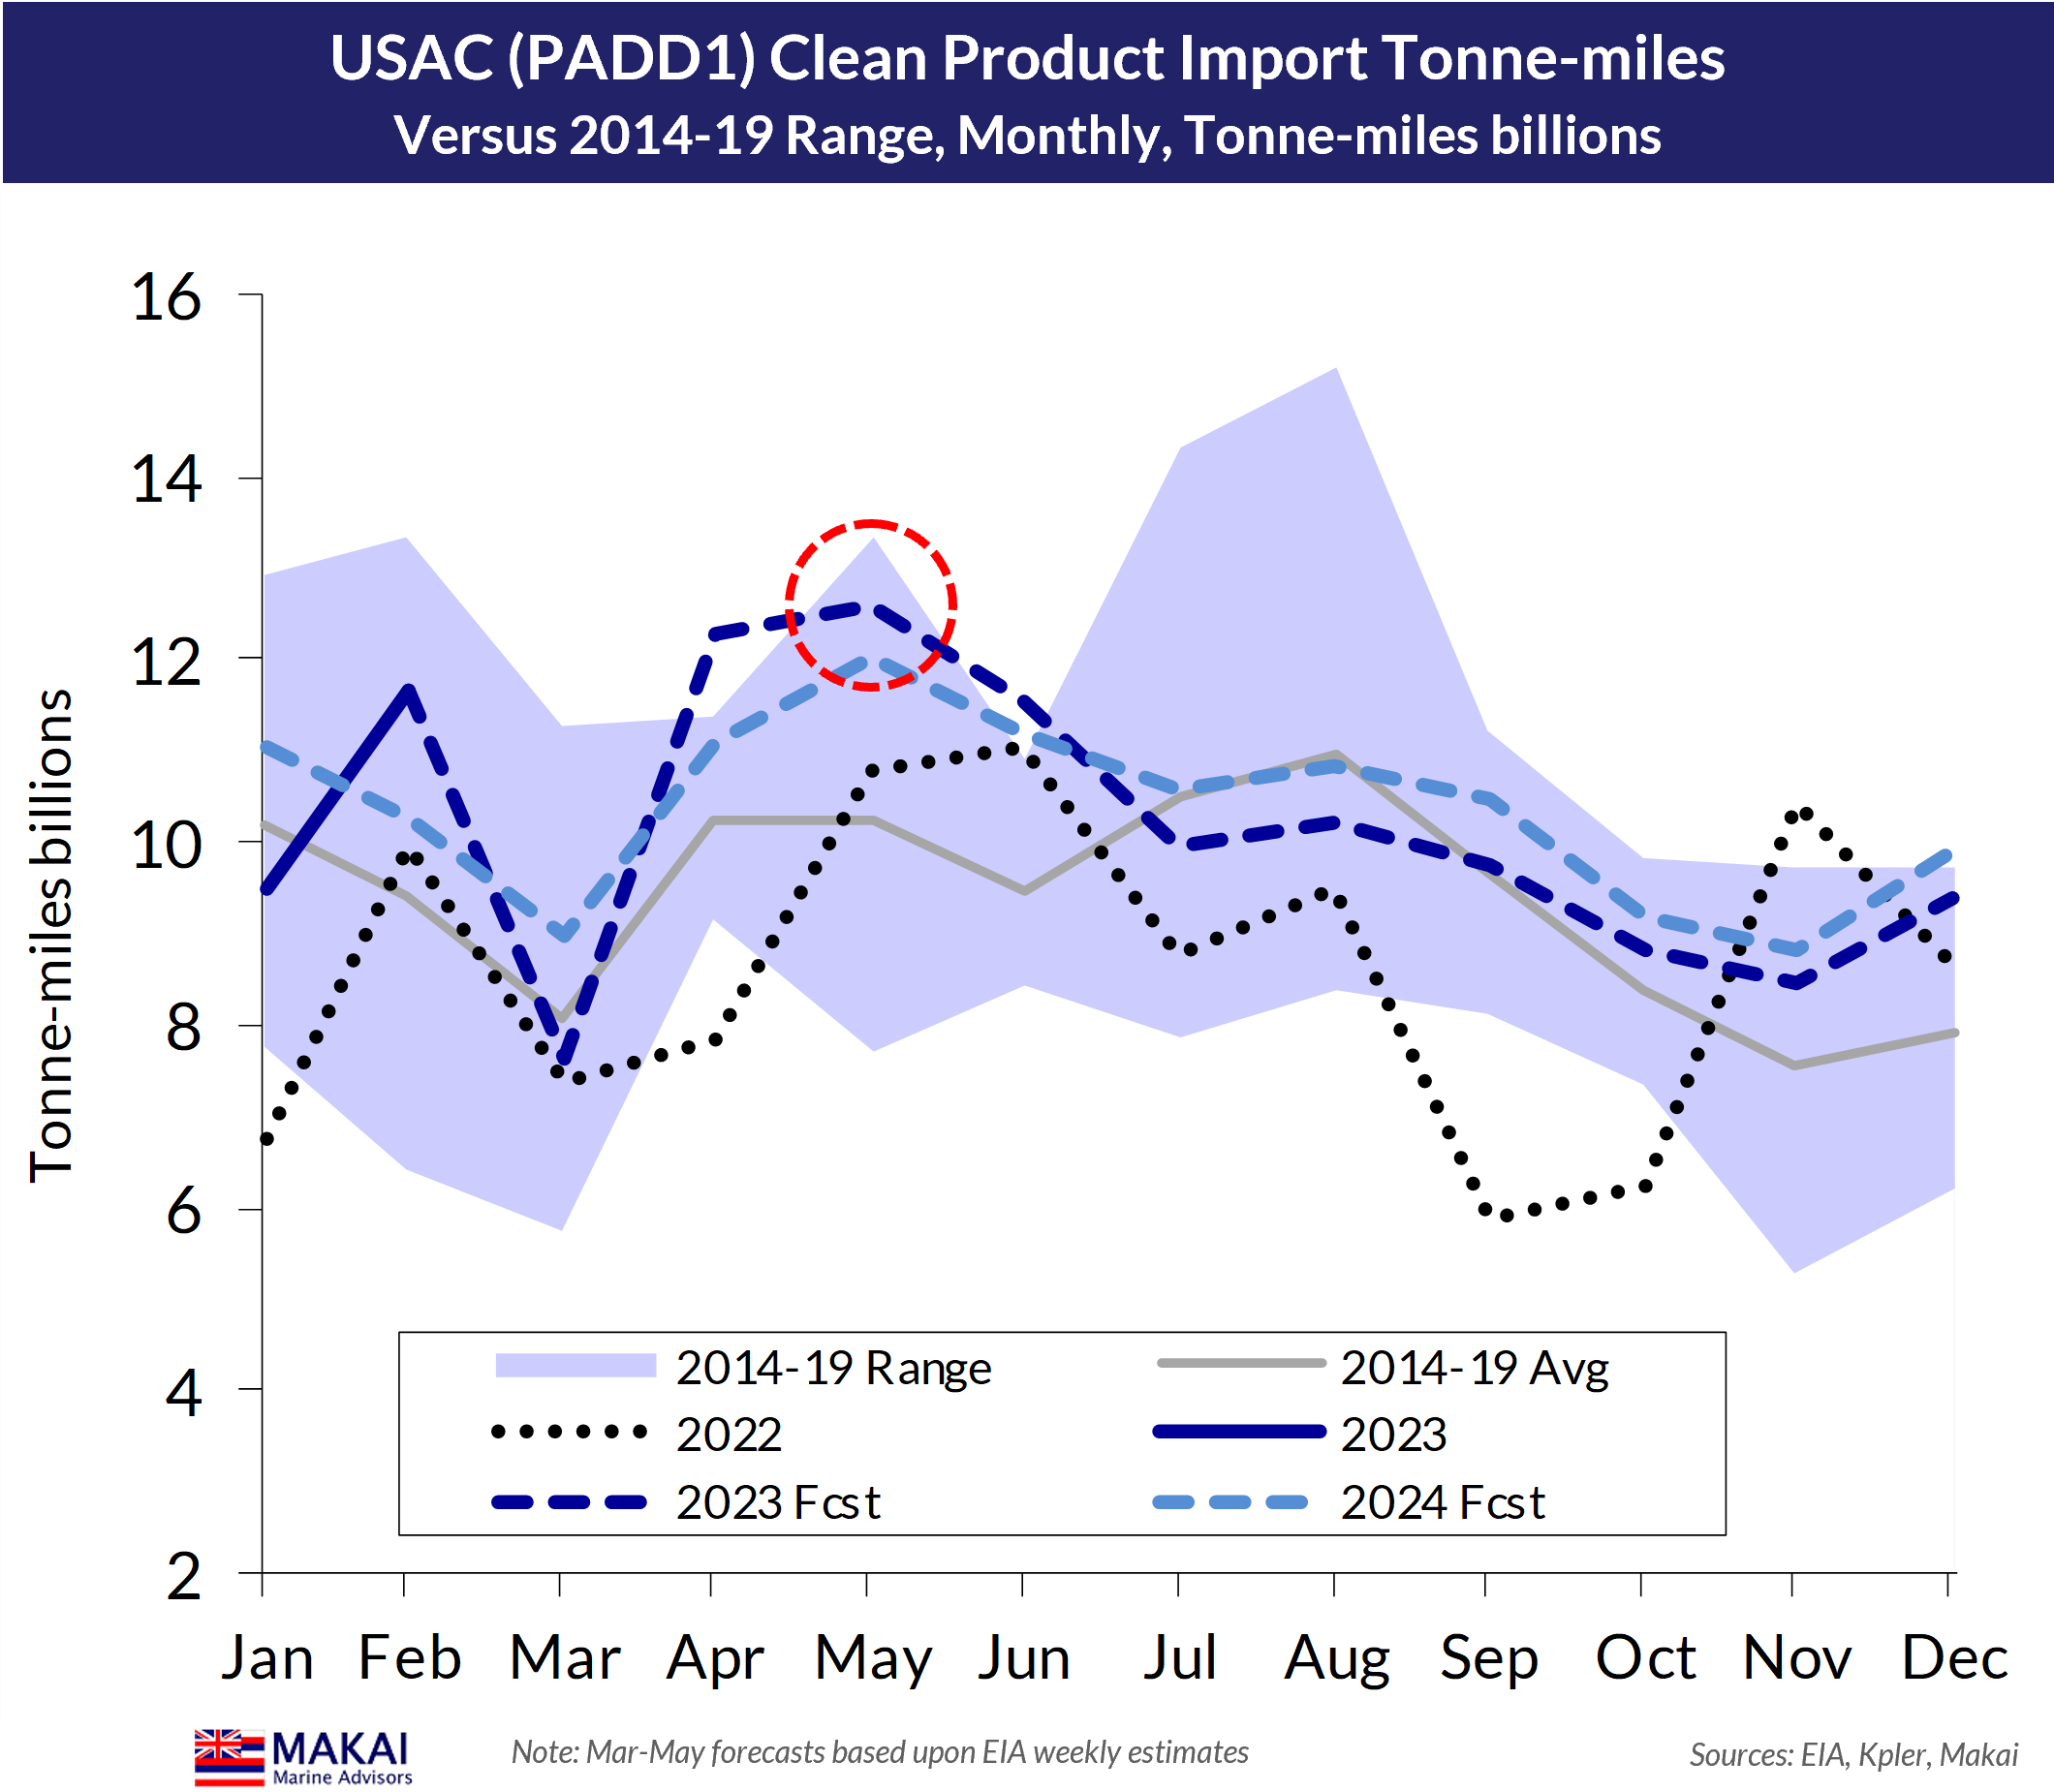
Total Clean Products -- Amidst the various seasonality impulses between grades in PADD1, overall clean product demand remains relatively flat during the year (centre right chart). Amongst the EIA weekly data, the 300 bp plunge in jet yields for May to date looks suspicious, without a corresponding rise in diesel yields. Nevertheless, PADD1 clean product imports are running near their usual May peak, with the subsequent import declines through November (lower right).


Tanker Demand Cresting for the Year (and then some)
Caught in this seasonal pattern for clean imports, near-term tanker demand for imports into PADD1 offers few surprises, with tonne-mile demand also peaking at the moment. Forecast demand in 2h24 does reflect higher jet import requirements from Pacific Basin sources.
Examining the longer-term development of regional tanker demand does reveal a pattern of ULSD driving most of the tonne-mile excursions for PADD1, as importers scramble for longer-haul sources to meet winter demand. The record PADD1 tanker demand in 2021, shown below, was the result of both a colder winter and lower supplies from PADD3, also boosting imports for gasoline and other grades. In the future, jet fuel is likely to sustain tanker demand, with its AG and Indian sourcing, but the overall trend is lower, potentially interrupted by a possible Trainer refinery closure.
Sourcing of PADD1 clean imports has evolved, leading to higher laden distances, but has featured one consistent element. The refineries of the Canadian maritime provinces have provided a steady 230 kbpd of clean products to PADD1, despite the closure of the 115 kbpd Come by Chance refinery in Newfoundland. This has left Irving's 320 kbpd Saint John refinery in New Brunswick to carry the Canadian sourcing, only 527 nm from NYC.
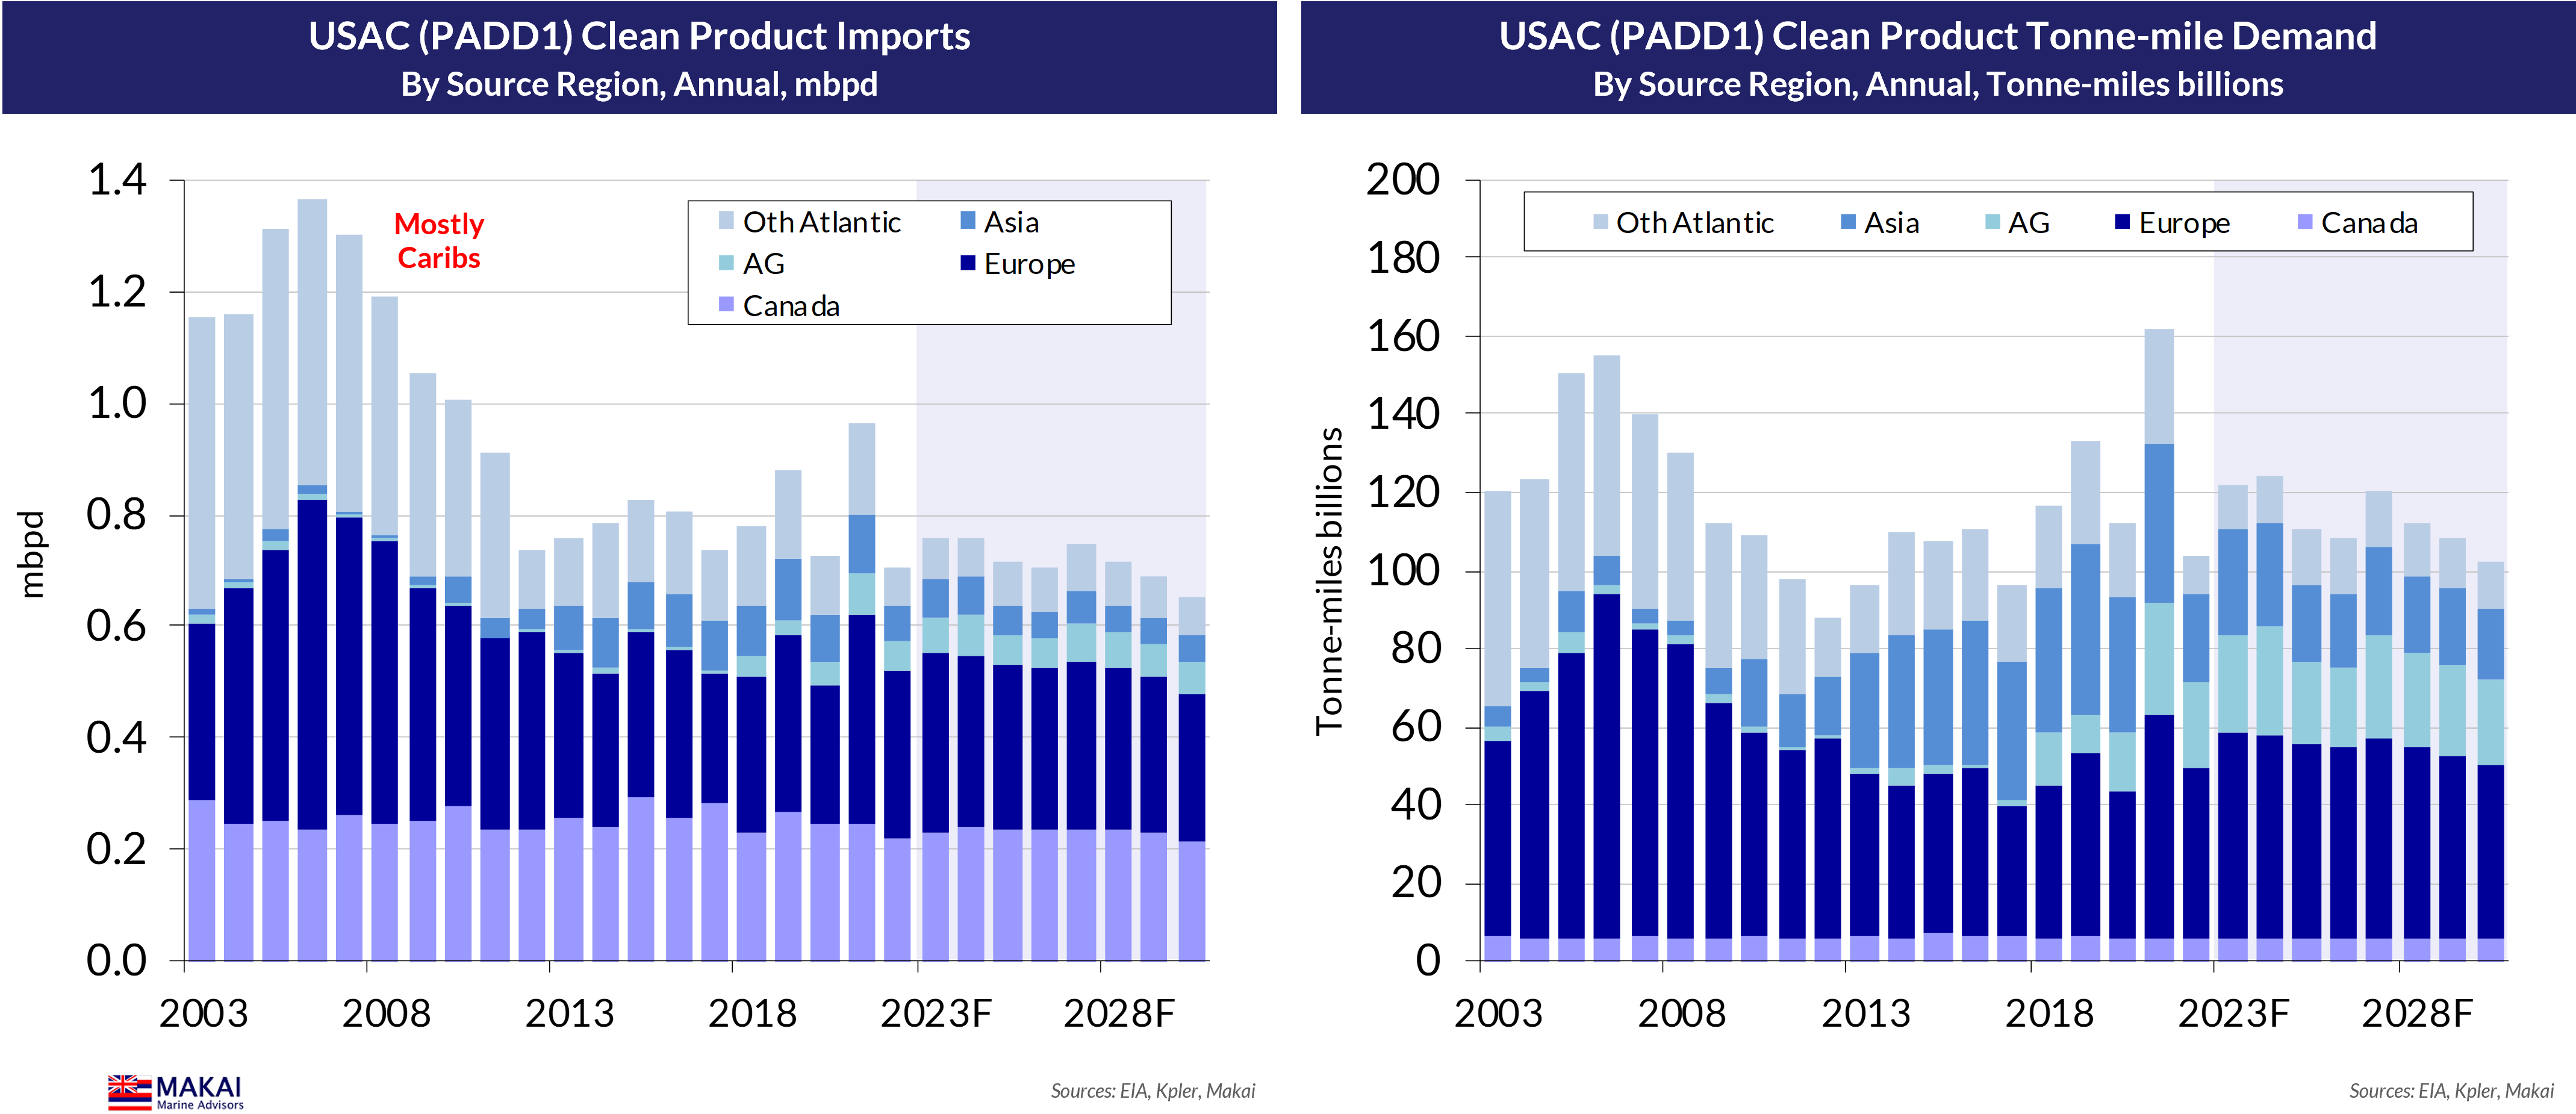
In addition to losing half of its own refining capacity, PADD1 also lost two key sources of refined products in 2012, from the closures of the Valero 235 kbpd Aruba refinery and the Hovensa 500 kbpd facility in USVI. At the peak of PADD1 demand and imports in 2006, Hovensa was meeting 19% of PADD1 imports, only 1,475 nm away. As shown below, this was a critical inflection point for PADD1, then forced to seek supplies from the Pacific Basin.
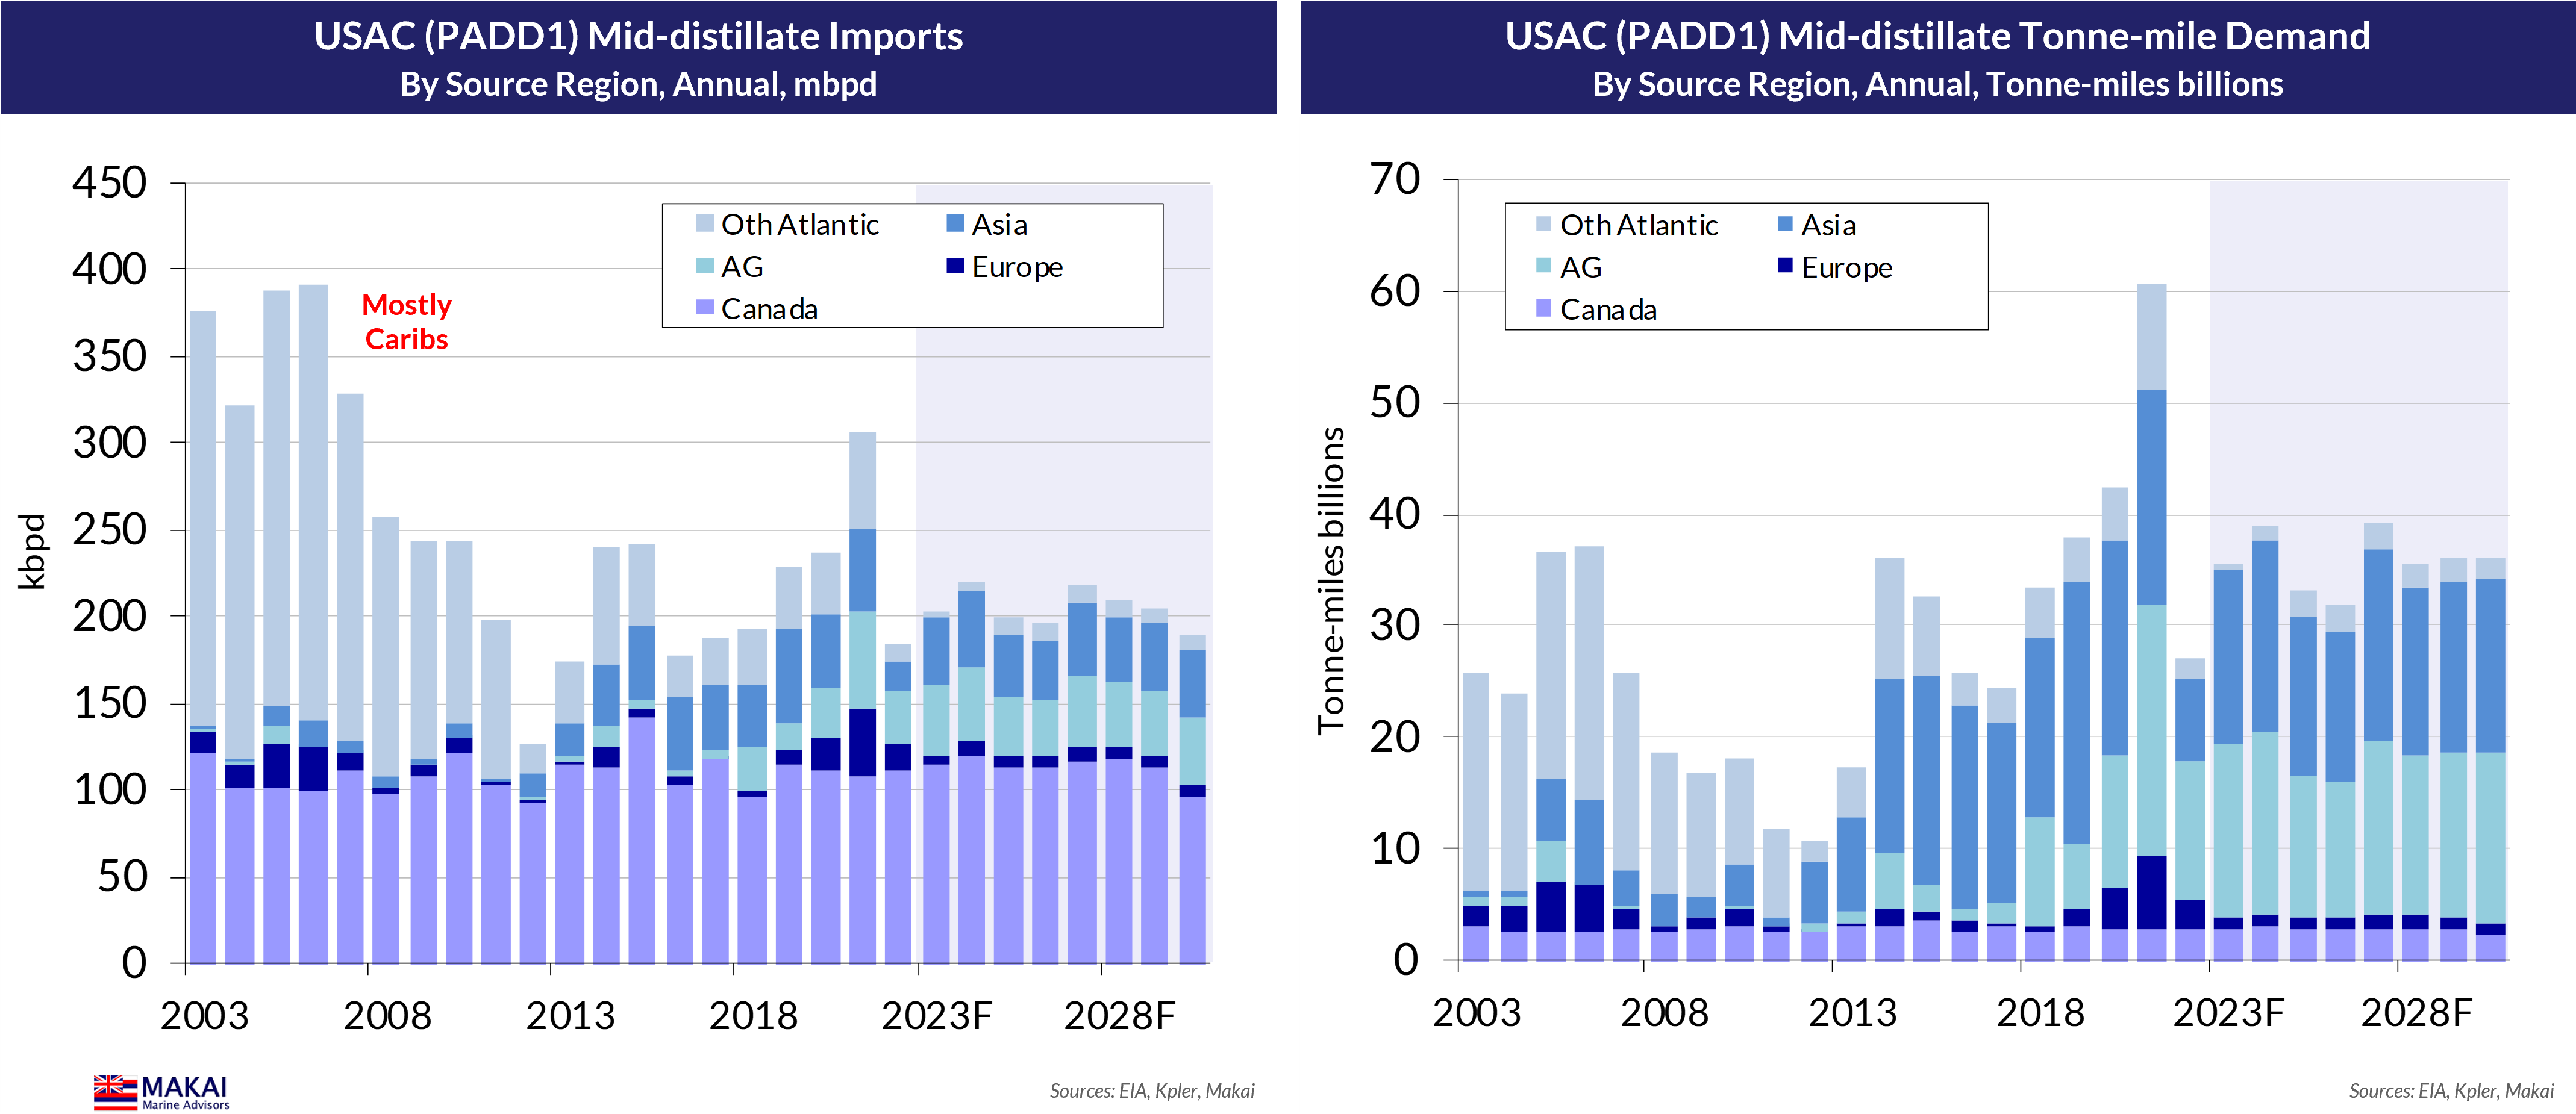
For PADD1, mid-distillate imports provide most of the tonne-mile excitement, with their reliance on AG, Indian and other Asian sources during winter demand. Tanker demand jumped after the Caribs refinery closures in 2012, and as more Northeastern states switched to ULSD for heating oil. A colder, more-normal winter could boost 2024 tonne-miles, but in later years, jet fuel becomes the more-prevalent force in import demand, as PADD1 diesel demand slips.
In contrast, Canadian and European souring dominate PADD1 gasoline imports, keeping tonne-miles in check, while continued gasoline demand declines should drive lower tanker demand.

Conclusion
Although the start of the US summer holiday season, and its associated jump in transport fuel demand, can create considerable excitement in the trade press and amongst certain market participants, PADD1 marches at a different cadence in meeting its fuel requirements. The region imports much of its seasonal needs before reaching its summer demand climax, when higher crude runs and flows from PADD3 take over the supply burden. Although PADD1 gasoline imports are likely to witness another spike or two in the weekly data during June, the overall tanker demand impulse will be waning during the month, starting its seasonal slide into November.
Although a colder winter could create some tanker demand excitement on sourcing ULSD from a distance, the overall trend in PADD1 clean tanker demand is lower, on sliding product demand. At its product demand peak during the 2000s, PADD1 import tonne-miles represented as much as 11% of the global total. Today, that global share is less than 4% and is slipping, calling into question the significance given to its inbound freight rates.
Disclaimer: Although care has been taken to ensure that information in this publication is accurate, it is a general guide and not intended to be relied upon for any specific purpose. Figures contained in this publication are based upon the latest available information, which is subject to frequent revision and correction. Makai Marine Advisors cannot accept any responsibility for any errors or omissions, or for any consequences, losses or damages incurred in any way by any person who may seek to rely on the information and views contained in this publication. This publication and the information contained herein may not be reproduced or redistributed, in whole or in part, without the written permission of Makai Marine Advisors.
No party for clean but they are making money on current rates so im holding