East Asia Products Co-Prosperity Sphere
ASEAN Part 2: Refinery expansion & North Asian supply limits tanker demand
In our previous post, we reviewed how rapidly-rising incomes and steady population growth are supporting strong oil demand gains in the ASEAN region. We jokingly gave the report a working title of “Charts that go up and to the right”, and it certainly did not disappoint on that score.
So an analysis of ASEAN clean product imports and tanker demand must generate the same chart trajectories, right? Indeed it does, but in the near term, the gradients are less dramatic, a function of moderate refinery capacity growth in the region and available North Asian supply.
This collides with one of the more pervasive narratives in the clean tanker markets -- refinery dislocation -- which argues that all new refinery capacity boosts clean tanker demand. The ASEAN region disproves this fallacy, while the narrative conveniently ignores those refineries in other regions built specifically to destroy import demand.
The key factors for ASEAN clean tanker demand include:
Modest refinery expansion keeps rising deficits under control -- Following the 2022 restart of Malaysia’s 300 kbpd RAPID refinery, the region has no massive refinery projects on the horizon, but moderate capacity expansion should add sufficient regional supply to keep product deficits rising at a manageable pace.
The ASEAN refining system is part of a regional trade ecosystem -- ASEAN countries see a high level of intra-regional trade relative to demand, while its North Asian trading partners meet much of the region’s external needs. This keeps regional voyage distances near a scant 1,000 nautical miles.
Singapore and Malaysia serve as entrepôts for the region -- Product deficits that cannot be met within Asia typically flow through the two countries, distributing product imports from west of Malacca. Russian naphtha has become a key re-export flow via Singapore.
Gasoline & jet fuel are driving tonne-mile growth -- Relentless gasoline demand growth, particularly in Indonesia, is fuelling imports, while jet fuel consumption soon outstrips Asian supply, requiring higher AG imports.
ASEAN tonne-mile demand requires global context -- Incremental tonne-mile demand from the region will add only 1.4% to global demand over the next five years. That one of the most dynamic oil demand growth regions of the world only requires a fraction of the massive clean orderbook should be pause for thought.
Gradual growth in ASEAN refining capacity
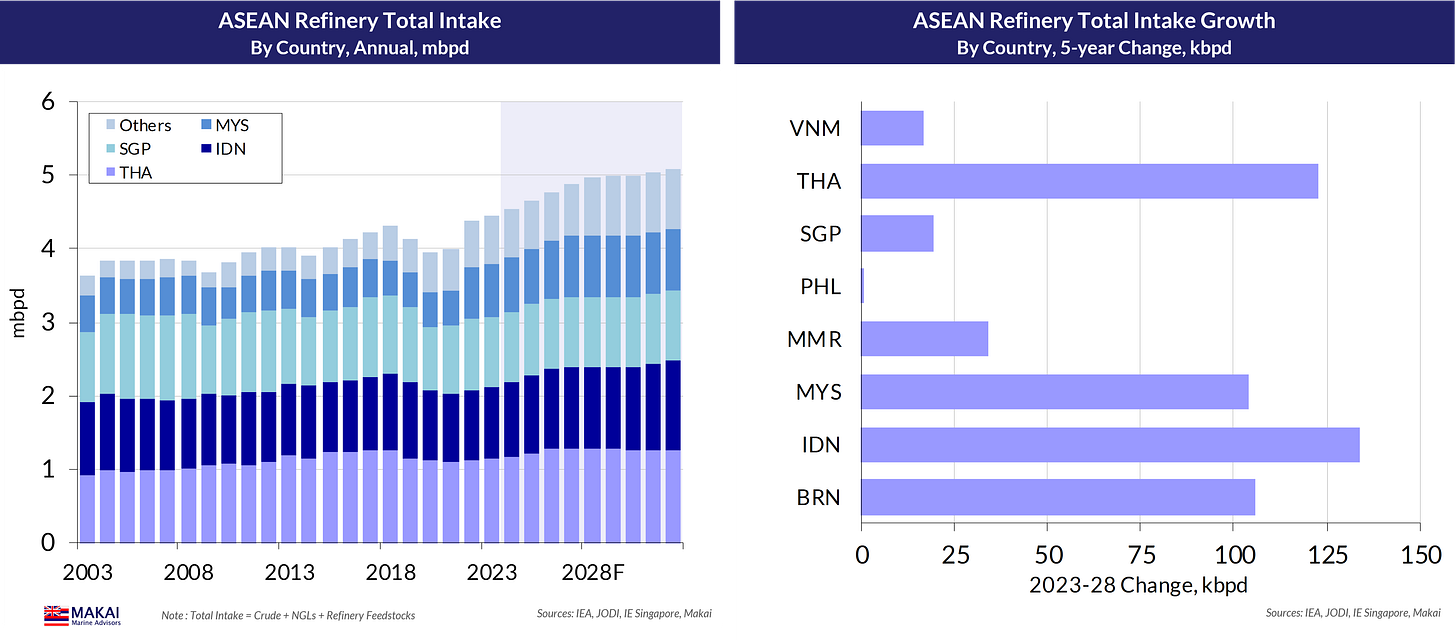
The 2022 re-start of the 300 kbpd Petronas RAPID refinery in Malaysia marked the last major greenfield ASEAN refinery project for the foreseeable future. Instead, smaller refinery expansions will boost regional distillation capacity by 0.6 mbpd during the next five years, including the recently-completed 100 kbpd expansion at Pertamina’s Balikpapan refinery.
Other expansion projects include Thai Oil’s 125 kbpd boost to its Sriracha refinery and Hengyi’s additional 130 kbpd to its Brunei facility. After 2028, however, the region has few credible refining projects that can realistically add to forecast ASEAN capacity, and as shown in the charts, growth flattens noticeably at this point. Given the rapid growth in forecast oil demand, this needs to change, and hopefully, we will see some project FIDs (Final Investment Decisions) emerging during the next couple of years, once the anticipated shortfall in global refining capacity becomes more apparent.
Naturally, the regional growth in refinery throughput follows these capacity additions (above), as does clean product refinery output (below). Notably, the clean product yields for ASEAN refiners have fallen, as more petrochemical-focused refineries have led the growth in capacity. Petrochemical precursor products, such as aromatics, have displaced traditional clean grades in the refinery output.
ASEAN product balances: deficits growing, but modestly
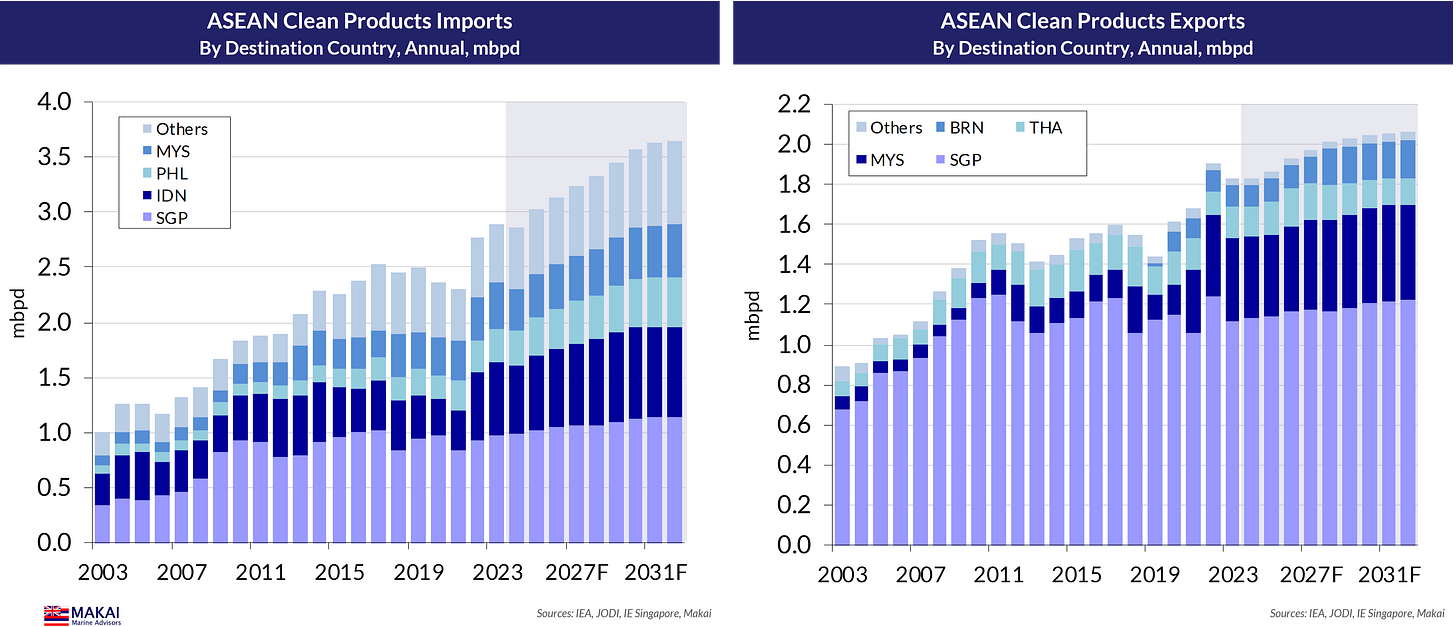
As shown below, rising oil demand outpaces the rise in refinery output, requiring higher imports, but the system also produces a substantial level of exports.
It is this interplay between regional imports and exports that frames the strong intra-regional product trade that defines ASEAN tanker demand. As illustrated below, regional imports exhibit boisterous growth, led by gasoline, while jet fuel imports start to accelerate. Gasoline also dominates the ASEAN export flows.
ASEAN net imports by grade (below) provide a better insight to the region’s external sourcing needs, which are resuming their growth, following a pause during the Covid pandemic. Collapsing jet fuel demand drove net exports during Covid, but ASEAN becomes a net importer of jet fuel next year, as refiners’ 11% jet yields cannot meet growing demand.
As we have seen elsewhere, the rapid import gains from a post-pandemic recovery in demand are slowing after 2023. The decline in 2024 ASEAN net imports is from the Balikpapan refinery expansion and from a recovery in Brunei crude runs and product output.
The drivers of this near-term decline becomes clearer when examining net imports by country, shown above. Meanwhile, The Philippines, which shut down a third of its refining capacity during 2020, has emerged as a substantial clean products importer.
Singapore and Malaysia dominate ASEAN clean exports, while fulfilling their role as entrepôts, bringing in material from West of the Malacca Strait and redistributing it throughout the region. Brunei, with its minute demand, functions as a pure export refiner.
ASEAN product import sourcing: it’s a local thing
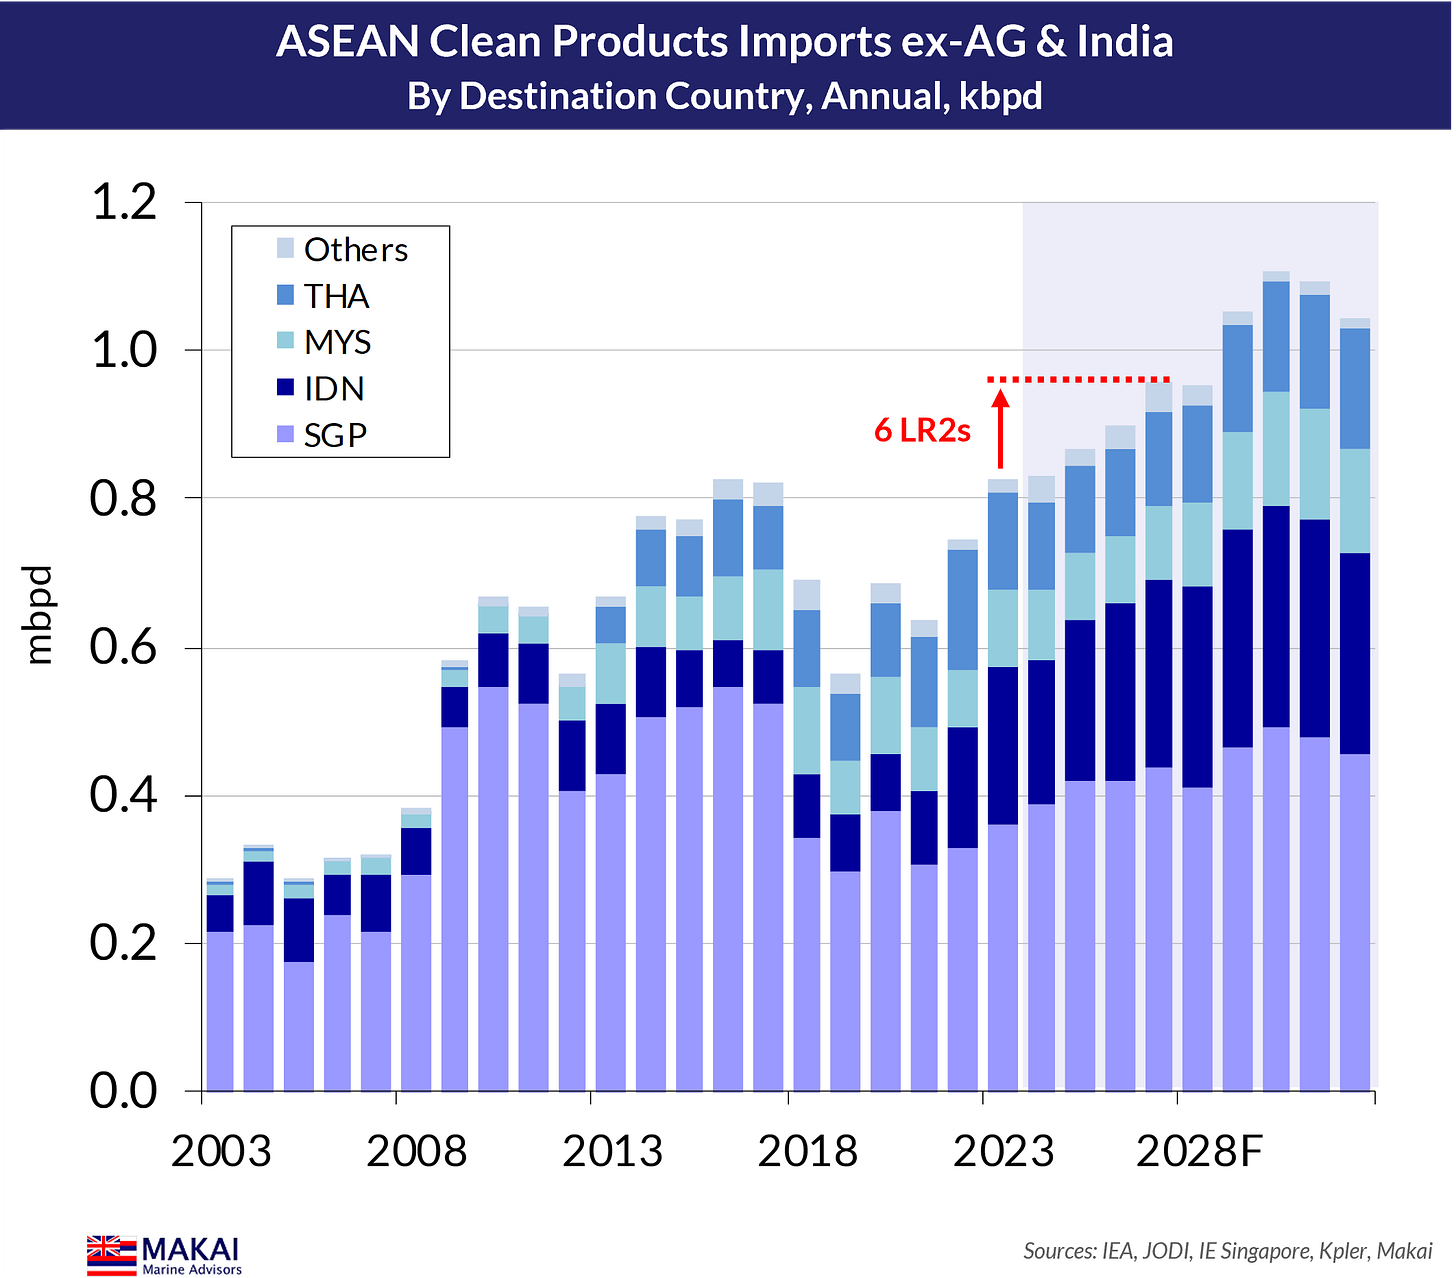
While the ASEAN nations are resuming their upward trend in product imports, Asian exporters provide the vast majority of products, with a 79% share. Excluding India’s 13% share (below), the region receives 66% of its imports from East of Malacca, limiting voyage distances and tonne-mile demand.
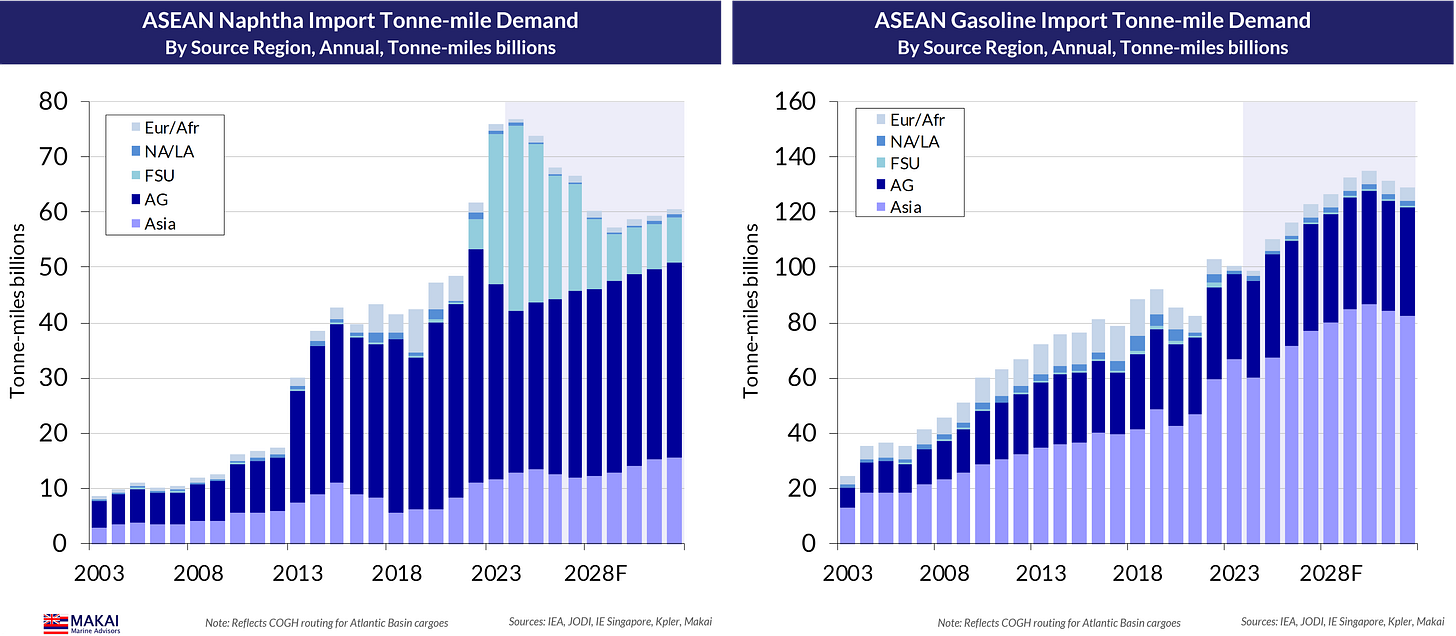
Of course, sourcing patterns do vary by product grade. The Arabian Gulf (AG) exporters dominate naphtha imports, while Singapore has been importing large volumes of Russian naphtha for its own needs and for redistribution to Korea, who is “officially” shunning Russian imports. Gasoline and gasoil imports remain a local affair, while the rapid rise in jet import requirements outstrips Asian supply and requires greater AG sourcing.
Methodological note: we balance all forecast import flows by country and grade with the export availability of each exporting country, based upon their individual refining mass balance models.
As for imports from Asia (below charts), India plays a dominant role in naphtha flows, while China, as a major importer, supplies only a trickle. Going forward, the Middle Kingdom should provide greater volumes and shares of middle distillates, but gasoline exports will depend upon the pace of EV adoption. India becomes constrained on jet exports overall, while surging Chinese diesel exports would squeeze it out of the import slate.
In terms of ASEAN destinations (below), naphtha imports flow to the three regional naphtha consumers, but Singaporean imports reflect re-exported flows to other Asia, especially Russian material. Indonesia is the leading gasoline importer in the region, consistent with its demand levels, while Singapore’s jet imports reflect the recent expansion of Changi Airport capacity and re-exports of AG/Indian jet to Australia.
ASEAN tonne-mile demand: consequences of going local
Not surprisingly, the substantial level of intra-regional products trade for the ASEAN nations does limit tonne-mile demand for the region. As shown below, the average voyage distance for ASEAN imports sourced east of Malacca is roughly 1,100 nm, which keeps the overall voyage distances close to a very low 2,000 nm.
With an available supply of regional clean products from moderate refinery expansion, this regional trading dynamic limits near-term gains in tonne-mile (TM) demand. Although all of the ASEAN demand and product import charts impress visually, with their upward angle, the resulting TM demand remains a question of context. As shown below, ASEAN import demand will only add 1.4% to global TM demand during the next five years, at a time when clean tonnage supply will be surging.
TM demand in the later years of the forecast period will depend upon the behaviour of Chinese refiners and the trajectory of EV development, as well as Asian product balances and the ability to take more Chinese exports.
As shown above, gasoline imports are driving much of the TM demand growth, led by Indonesia’s insatiable import needs, while the dramatic rise in jet tonne-miles has a moderate impact on total demand, given its minor position in the import slate today.
Regional TM demand by grade (above) offers few surprises, but the need for increased AG and Indian jet does boost tonne-miles dramatically. Naphtha TM demand will depend on the level of Russian naphtha into Singapore, and how sustainable the re-export of this material into Korea is, under tightened sanctions scrutiny there.
Again, the TM demand impact from ASEAN imports requires global context. Import gains from the AG and India would only require an additional six LR2s over the next five years, given the geographic proximity of the destination countries. Intra-regional trade growth would require another 20 MRs, assuming no triangulation. When one of the most dynamic oil demand growth regions of the world only requires a tiny fraction of the massive clean orderbook, this should be sparking some serious questions.
Conclusions
Of course, it is not. This analytical pathway collides head-on with numerous market narratives and casual correlations.
This includes the refinery dislocation narrative, which asserts that all new refining capacity adds to clean tanker demand. The ASEAN tanker demand outlook proves that this is categorically false, while the narrative conveniently ignores those refineries designed specifically to destroy clean imports (e.g., Dangote, Dos Bocas).
Another popular narrative is that rapidly-rising global oil demand will drive much higher clean tanker demand. Again, ASEAN is a countervailing case, but this narrative also ignores the fact that at least 90% of incremental clean demand over the next five years will be located in regions with excess refining capacity -- AG, India, China. (Chinese naphtha demand has been an exception to date, but in our next report, we will address the uninspiring trajectory of total Asia naphtha import demand in the future.)
ASEAN clean demand growth represents another 20% of incremental consumption, so this leaves the question of how regions with shrinking clean demand will generate enough tanker demand growth to support a massive orderbook. For example, one pocket of demand growth, the forecast recovery in European mid-distillate imports, would require only another 15 LR2s. When you roll out the analysis globally, the numbers become whimsical.


